Yahoo 2015 Annual Report Download - page 45
Download and view the complete annual report
Please find page 45 of the 2015 Yahoo annual report below. You can navigate through the pages in the report by either clicking on the pages listed below, or by using the keyword search tool below to find specific information within the annual report.-
 1
1 -
2
-
3
-
4
-
5
-
6
-
7
-
8
-
9
-
10
-
11
-
12
-
13
-
14
-
15
-
16
-
17
-
18
-
19
-
20
-
21
-
22
-
23
-
24
-
25
-
26
-
27
-
28
-
29
-
30
-
31
-
32
-
33
-
34
-
 35
35 -
 36
36 -
 37
37 -
 38
38 -
 39
39 -
 40
40 -
 41
41 -
 42
42 -
 43
43 -
 44
44 -
 45
45 -
 46
46 -
 47
47 -
 48
48 -
 49
49 -
 50
50 -
 51
51 -
 52
52 -
 53
53 -
 54
54 -
 55
55 -
56
-
57
-
58
-
59
-
60
-
61
-
62
-
63
-
64
-
65
-
66
-
67
-
68
-
69
-
70
-
71
-
72
-
73
-
74
-
75
-
76
-
77
-
78
-
79
-
80
-
81
-
82
-
83
-
84
-
85
-
86
-
87
-
88
-
89
-
90
-
91
-
92
-
93
-
94
-
95
-
96
-
97
-
98
-
99
-
100
-
101
-
102
-
103
-
104
-
105
-
106
-
107
-
108
-
109
-
110
-
111
-
112
-
113
-
114
-
115
-
116
-
117
-
118
-
119
-
120
-
121
-
122
-
123
-
124
-
125
-
126
-
127
-
128
-
129
-
130
-
131
-
132
-
133
-
134
-
135
-
136
-
137
-
138
-
139
-
140
-
141
-
142
-
143
-
144
-
145
-
146
-
147
-
148
-
149
-
150
-
151
-
152
-
153
-
154
-
155
-
156
-
157
-
158
-
159
-
160
-
161
-
162
-
163
-
164
-
165
-
166
-
167
-
168
-
169
-
170
-
171
-
172
-
173
-
174
-
175
-
176
-
177
-
178
-
179
-
180
 |
 |
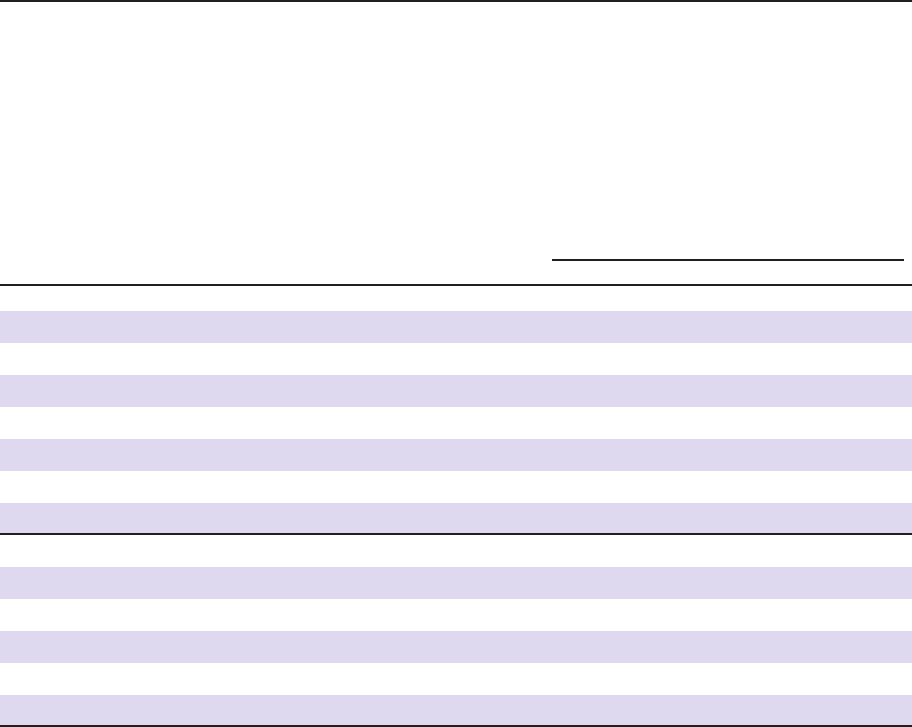
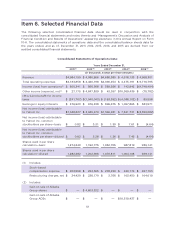
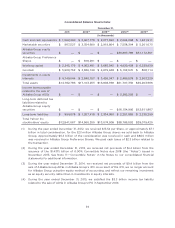
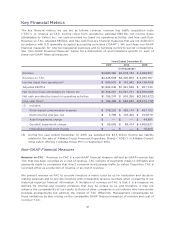
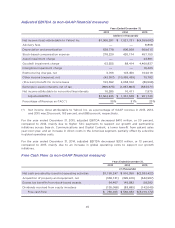
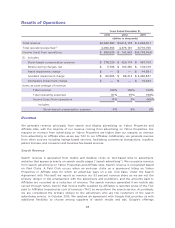
Key Financial Metrics
The key financial metrics we use are as follows: revenue; revenue less traffic acquisition costs
(“TAC”), or revenue ex-TAC; income (loss) from operations; adjusted EBITDA; net income (loss)
attributable to Yahoo! Inc.; net cash provided by (used in) operating activities; and free cash flow.
Revenue ex-TAC, adjusted EBITDA, and free cash flow are financial measures that are not defined in
accordance with U.S. generally accepted accounting principles (“GAAP”). We use these non-GAAP
financial measures for internal managerial purposes and to facilitate period-to-period comparisons.
See “Non-GAAP Financial Measures” below for a description of, and limitations specific to, each of
these non-GAAP financial measures.
Years Ended December 31,
2013 2014 2015
(in thousands)
Revenue
$4,680,380 $4,618,133 $ 4,968,301
Revenue ex-TAC
$4,425,938 $4,400,602 $ 4,090,787
Income (loss) from operations(1)
$ 589,926 $ 142,942 $(4,748,494)
Adjusted EBITDA
$1,564,245 $1,361,548 $ 951,740
Net income (loss) attributable to Yahoo! Inc.
$1,366,281 $7,521,731 $(4,359,082)
Net cash provided by (used in) operating activities
$1,195,247 $ 916,350 $(2,383,422)
Free cash flow(2)
$ 786,465 $ 586,632 $(3,010,172)
(1) Includes:
Stock-based compensation expense
$ 278,220 $ 420,174 $ 457,153
Restructuring charges, net
$ 3,766 $ 103,450 $ 104,019
Asset impairment charge
$ — $ — $ 44,381
Goodwill impairment charge
$ 63,555 $ 88,414 $ 4,460,837
Intangibles impairment charge
$ — $ — $ 15,423
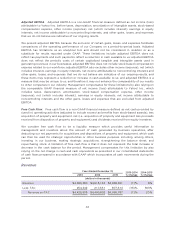
(2) During the year ended December 31, 2015, we satisfied the $3.3 billion income tax liability
related to the sale of Alibaba Group American Depositary Shares (“ADSs”) in Alibaba Group’s
initial public offering (“Alibaba Group IPO”) in September 2014.
Non-GAAP Financial Measures
Revenue ex-TAC. Revenue ex-TAC is a non-GAAP financial measure defined as GAAP revenue less
TAC that has been recorded as a cost of revenue. TAC consists of payments made to Affiliates and
payments made to companies that direct consumer and business traffic to Yahoo Properties. TAC is
recorded either as a reduction of revenue or as cost of revenue.
We present revenue ex-TAC to provide investors a metric used by us for evaluation and decision-
making purposes and to provide investors with comparable revenue numbers when comparing to our
historical reported financial information. A limitation of revenue ex-TAC is that it is a measure we
defined for internal and investor purposes that may be unique to us, and therefore it may not
enhance the comparability of our results to those of other companies in our industry who have similar
business arrangements but address the impact of TAC differently. Management compensates for
these limitations by also relying on the comparable GAAP financial measures of revenue and cost of
revenue—TAC.
41