Yahoo 2015 Annual Report Download - page 49
Download and view the complete annual report
Please find page 49 of the 2015 Yahoo annual report below. You can navigate through the pages in the report by either clicking on the pages listed below, or by using the keyword search tool below to find specific information within the annual report.-
 1
1 -
2
-
3
-
4
-
5
-
6
-
7
-
8
-
9
-
10
-
11
-
12
-
13
-
14
-
15
-
16
-
17
-
18
-
19
-
20
-
21
-
22
-
23
-
24
-
25
-
26
-
27
-
28
-
29
-
30
-
31
-
32
-
33
-
34
-
35
-
36
-
37
-
38
-
 39
39 -
 40
40 -
 41
41 -
 42
42 -
 43
43 -
 44
44 -
 45
45 -
 46
46 -
 47
47 -
 48
48 -
 49
49 -
 50
50 -
 51
51 -
 52
52 -
 53
53 -
 54
54 -
 55
55 -
 56
56 -
 57
57 -
 58
58 -
 59
59 -
60
-
61
-
62
-
63
-
64
-
65
-
66
-
67
-
68
-
69
-
70
-
71
-
72
-
73
-
74
-
75
-
76
-
77
-
78
-
79
-
80
-
81
-
82
-
83
-
84
-
85
-
86
-
87
-
88
-
89
-
90
-
91
-
92
-
93
-
94
-
95
-
96
-
97
-
98
-
99
-
100
-
101
-
102
-
103
-
104
-
105
-
106
-
107
-
108
-
109
-
110
-
111
-
112
-
113
-
114
-
115
-
116
-
117
-
118
-
119
-
120
-
121
-
122
-
123
-
124
-
125
-
126
-
127
-
128
-
129
-
130
-
131
-
132
-
133
-
134
-
135
-
136
-
137
-
138
-
139
-
140
-
141
-
142
-
143
-
144
-
145
-
146
-
147
-
148
-
149
-
150
-
151
-
152
-
153
-
154
-
155
-
156
-
157
-
158
-
159
-
160
-
161
-
162
-
163
-
164
-
165
-
166
-
167
-
168
-
169
-
170
-
171
-
172
-
173
-
174
-
175
-
176
-
177
-
178
-
179
-
180
 |
 |

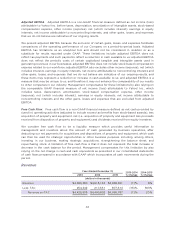
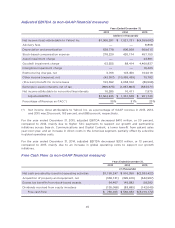
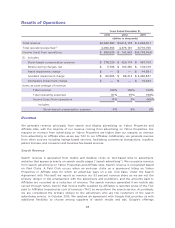
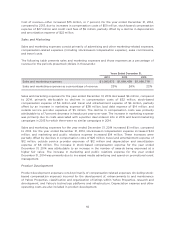
Adjusted EBITDA (a non-GAAP financial measure)
Years Ended December 31,
2013 2014 2015
(dollars in thousands)
Net income (loss) attributable to Yahoo! Inc.
$1,366,281 $ 7,521,731 $(4,359,082)
Advisory fees
— — 8,808
Depreciation and amortization
628,778 606,568 609,613
Stock-based compensation expense
278,220 420,174 457,153
Asset impairment charge
— — 44,381
Goodwill impairment charge
63,555 88,414 4,460,837
Intangibles impairment charge
— — 15,423
Restructuring charges, net
3,766 103,450 104,019
Other income (expense), net
(43,357) (10,369,439) 75,782
(Provision) benefit for income taxes
153,392 4,038,102 (89,598)
Earnings in equity interests, net of tax
(896,675) (1,057,863) (383,571)
Net income attributable to noncontrolling interests
10,285 10,411 7,975
Adjusted EBITDA
$1,564,245 $ 1,361,548 $ 951,740
Percentage of Revenue ex-TAC(*)
35% 31% 23%
(*) Net income (loss) attributable to Yahoo! Inc. as a percentage of GAAP revenue in 2013, 2014,
and 2015 was 29 percent, 163 percent, and (88) percent, respectively.
For the year ended December 31, 2015, adjusted EBITDA decreased $410 million, or 30 percent,
compared to 2014, mainly due to higher TAC payments to support our growth and partnership
initiatives across Search, Communications and Digital Content, a lower benefit from patent sales
year-over-year, and an increase in direct costs in the Americas segment, partially offset by a decline
in global operating costs.
For the year ended December 31, 2014, adjusted EBITDA decreased $203 million, or 13 percent,
compared to 2013, mainly due to an increase in global operating costs to support our growth
initiatives.
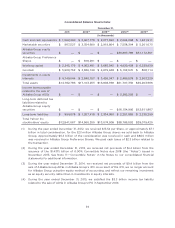
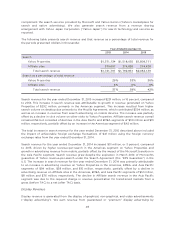
Free Cash Flow (a non-GAAP financial measure)
Years Ended December 31,
2013 2014 2015
(in thousands)
Net cash provided by (used in) operating activities
$1,195,247 $ 916,350 $(2,383,422)
Acquisition of property and equipment, net
(338,131) (395,615) (542,987)
Excess tax benefits from stock-based awards
64,407 149,582 58,282
Dividends received from equity investees
(135,058) (83,685) (142,045)
Free cash flow
$ 786,465 $ 586,632 $(3,010,172)
45