Yahoo 2015 Annual Report Download - page 41
Download and view the complete annual report
Please find page 41 of the 2015 Yahoo annual report below. You can navigate through the pages in the report by either clicking on the pages listed below, or by using the keyword search tool below to find specific information within the annual report.-
 1
1 -
2
-
3
-
4
-
5
-
6
-
7
-
8
-
9
-
10
-
11
-
12
-
13
-
14
-
15
-
16
-
17
-
18
-
19
-
20
-
21
-
22
-
23
-
24
-
25
-
26
-
27
-
28
-
29
-
30
-
 31
31 -
 32
32 -
 33
33 -
 34
34 -
 35
35 -
 36
36 -
 37
37 -
 38
38 -
 39
39 -
 40
40 -
 41
41 -
 42
42 -
 43
43 -
 44
44 -
 45
45 -
 46
46 -
 47
47 -
 48
48 -
 49
49 -
 50
50 -
 51
51 -
52
-
53
-
54
-
55
-
56
-
57
-
58
-
59
-
60
-
61
-
62
-
63
-
64
-
65
-
66
-
67
-
68
-
69
-
70
-
71
-
72
-
73
-
74
-
75
-
76
-
77
-
78
-
79
-
80
-
81
-
82
-
83
-
84
-
85
-
86
-
87
-
88
-
89
-
90
-
91
-
92
-
93
-
94
-
95
-
96
-
97
-
98
-
99
-
100
-
101
-
102
-
103
-
104
-
105
-
106
-
107
-
108
-
109
-
110
-
111
-
112
-
113
-
114
-
115
-
116
-
117
-
118
-
119
-
120
-
121
-
122
-
123
-
124
-
125
-
126
-
127
-
128
-
129
-
130
-
131
-
132
-
133
-
134
-
135
-
136
-
137
-
138
-
139
-
140
-
141
-
142
-
143
-
144
-
145
-
146
-
147
-
148
-
149
-
150
-
151
-
152
-
153
-
154
-
155
-
156
-
157
-
158
-
159
-
160
-
161
-
162
-
163
-
164
-
165
-
166
-
167
-
168
-
169
-
170
-
171
-
172
-
173
-
174
-
175
-
176
-
177
-
178
-
179
-
180
 |
 |

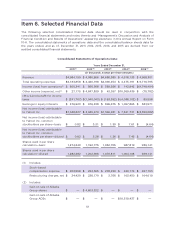
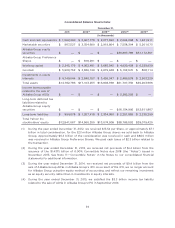
Item 6. Selected Financial Data
The following selected consolidated financial data should be read in conjunction with the
consolidated financial statements and notes thereto and “Management’s Discussion and Analysis of
Financial Condition and Results of Operations” appearing elsewhere in this Annual Report on Form
10-K. The consolidated statements of operations data and the consolidated balance sheets data for
the years ended, and as of, December 31, 2011, 2012, 2013, 2014, and 2015 are derived from our
audited consolidated financial statements.
Consolidated Statements of Operations Data:
Years Ended December 31,
2011(3) 2012(4) 2013(5) 2014(6) 2015(7)
(in thousands, except per share amounts)
Revenue
$4,984,199 $ 4,986,566 $4,680,380 $ 4,618,133 $ 4,968,301
Total operating expenses
$4,183,858 $ 4,420,198 $4,090,454 $ 4,475,191 $ 9,716,795
Income (loss) from operations(1)
$ 800,341 $ 566,368 $ 589,926 $ 142,942 $(4,748,494)
Other income (expense), net(2)
$ 27,175 $ 4,647,839 $ 43,357 $10,369,439 $ (75,782)
(Provision) benefit for income
taxes
$ (241,767) $(1,940,043) $ (153,392) $ (4,038,102) $ 89,598
Earnings in equity interests
$ 476,920 $ 676,438 $ 896,675 $ 1,057,863 $ 383,571
Net income (loss) attributable
to Yahoo! Inc.
$1,048,827 $ 3,945,479 $1,366,281 $ 7,521,731 $(4,359,082)
Net income (loss) attributable
to Yahoo! Inc. common
stockholders per share—basic
$ 0.82 $ 3.31 $ 1.30 $ 7.61 $ (4.64)
Net income (loss) attributable
to Yahoo! Inc. common
stockholders per share—diluted
$ 0.82 $ 3.28 $ 1.26 $ 7.45 $ (4.64)
Shares used in per share
calculation—basic
1,274,240 1,192,775 1,052,705 987,819 939,141
Shares used in per share
calculation—diluted
1,282,282 1,202,906 1,070,811 1,004,108 939,141
(1) Includes:
Stock-based
compensation expense
$ 203,958 $ 224,365 $ 278,220 $ 420,174 $ 457,153
Restructuring charges, net
$ 24,420 $ 236,170 $ 3,766 $ 103,450 $ 104,019
(2) Includes:
Gain on sale of Alibaba
Group shares
$ — $ 4,603,322 $ — $ — $ —
Gain on sale of Alibaba
Group ADSs
$ — $ — $ — $10,319,437 $ —
37