Yahoo 2015 Annual Report Download - page 87
Download and view the complete annual report
Please find page 87 of the 2015 Yahoo annual report below. You can navigate through the pages in the report by either clicking on the pages listed below, or by using the keyword search tool below to find specific information within the annual report.-
 1
1 -
2
-
3
-
4
-
5
-
6
-
7
-
8
-
9
-
10
-
11
-
12
-
13
-
14
-
15
-
16
-
17
-
18
-
19
-
20
-
21
-
22
-
23
-
24
-
25
-
26
-
27
-
28
-
29
-
30
-
31
-
32
-
33
-
34
-
35
-
36
-
37
-
38
-
39
-
40
-
41
-
42
-
43
-
44
-
45
-
46
-
47
-
48
-
49
-
50
-
51
-
52
-
53
-
54
-
55
-
56
-
57
-
58
-
59
-
60
-
61
-
62
-
63
-
64
-
65
-
66
-
67
-
68
-
69
-
70
-
71
-
72
-
73
-
74
-
75
-
76
-
 77
77 -
 78
78 -
 79
79 -
 80
80 -
 81
81 -
 82
82 -
 83
83 -
 84
84 -
 85
85 -
 86
86 -
 87
87 -
 88
88 -
 89
89 -
 90
90 -
 91
91 -
 92
92 -
 93
93 -
 94
94 -
 95
95 -
 96
96 -
 97
97 -
98
-
99
-
100
-
101
-
102
-
103
-
104
-
105
-
106
-
107
-
108
-
109
-
110
-
111
-
112
-
113
-
114
-
115
-
116
-
117
-
118
-
119
-
120
-
121
-
122
-
123
-
124
-
125
-
126
-
127
-
128
-
129
-
130
-
131
-
132
-
133
-
134
-
135
-
136
-
137
-
138
-
139
-
140
-
141
-
142
-
143
-
144
-
145
-
146
-
147
-
148
-
149
-
150
-
151
-
152
-
153
-
154
-
155
-
156
-
157
-
158
-
159
-
160
-
161
-
162
-
163
-
164
-
165
-
166
-
167
-
168
-
169
-
170
-
171
-
172
-
173
-
174
-
175
-
176
-
177
-
178
-
179
-
180
 |
 |

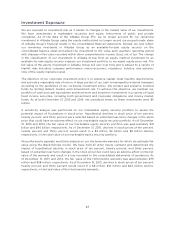
Investment Exposure
We are exposed to investment risk as it relates to changes in the market value of our investments.
We have investments in marketable securities and equity instruments of public and private
companies. As of the date of the Alibaba Group IPO, we no longer account for our remaining
investment in Alibaba Group using the equity method and no longer record our proportionate share
of Alibaba Group’s financial results in the consolidated financial statements. Instead, we now reflect
our remaining investment in Alibaba Group as an available-for-sale equity security on the
consolidated balance sheet and adjust the investment to fair value each quarterly reporting period
with changes in fair value recorded within other comprehensive income (loss), net of tax. The change
in the classification of our investment in Alibaba Group from an equity method investment to an
available-for-sale equity security exposes our investment portfolio to increased equity price risk. The
fair value of the equity investment in Alibaba Group will vary over time and is subject to a variety of
market risks including: company performance, macro-economic, regulatory, industry, and systemic
risks of the equity markets overall.
The objective of our corporate investment policy is to preserve capital, meet liquidity requirements,
and provide a reasonable rate of return. A large portion of our cash is managed by external managers
according to the guidelines of our corporate investment policy. We protect and preserve invested
funds by limiting default, market, and reinvestment risk. To achieve this objective, we maintain our
portfolio of cash and cash equivalents and short-term and long-term investments in a variety of liquid
fixed income securities, including both government and corporate obligations and money market
funds. As of both December 31, 2015 and 2014, net unrealized losses on these investments were $5
million.
A sensitivity analysis was performed on our marketable equity security portfolio to assess the
potential impact of fluctuations in stock price. Hypothetical declines in stock price of ten percent,
twenty percent, and thirty percent were selected based on potential near-term changes in the stock
price that could have an adverse effect on our marketable equity security portfolio. As of December
31, 2015 and 2014, the fair value of our marketable equity security portfolio was approximately $31
billion and $40 billion, respectively. As of December 31, 2015, declines in stock prices of ten percent,
twenty percent and thirty percent would result in a $3 billion, $6 billion and $9 billion decline,
respectively, in the total value of our marketable equity security portfolio.
We performed a separate sensitivity analysis on our Hortonworks warrants for which we estimate fair
value using the Black-Scholes model. We have held all other inputs constant and determined the
impact of hypothetical declines in stock price of ten percent, twenty percent, and thirty percent,
based on potential near-term changes in the stock price that could have an adverse effect on the fair
value of the warrants and result in a loss recorded to the consolidated statements of operations. As
of December 31, 2015 and 2014, the fair value of the Hortonworks warrants was approximately $79
million and $98 million, respectively. As of December 31, 2015, declines in stock prices of ten percent,
twenty percent and thirty percent would result in a $8 million, $16 million and $24 million decline,
respectively, in the total value of the Hortonworks warrants.
83