Yahoo 2015 Annual Report Download - page 78
Download and view the complete annual report
Please find page 78 of the 2015 Yahoo annual report below. You can navigate through the pages in the report by either clicking on the pages listed below, or by using the keyword search tool below to find specific information within the annual report.-
 1
1 -
2
-
3
-
4
-
5
-
6
-
7
-
8
-
9
-
10
-
11
-
12
-
13
-
14
-
15
-
16
-
17
-
18
-
19
-
20
-
21
-
22
-
23
-
24
-
25
-
26
-
27
-
28
-
29
-
30
-
31
-
32
-
33
-
34
-
35
-
36
-
37
-
38
-
39
-
40
-
41
-
42
-
43
-
44
-
45
-
46
-
47
-
48
-
49
-
50
-
51
-
52
-
53
-
54
-
55
-
56
-
57
-
58
-
59
-
60
-
61
-
62
-
63
-
64
-
65
-
66
-
67
-
 68
68 -
 69
69 -
 70
70 -
 71
71 -
 72
72 -
 73
73 -
 74
74 -
 75
75 -
 76
76 -
 77
77 -
 78
78 -
 79
79 -
 80
80 -
 81
81 -
 82
82 -
 83
83 -
 84
84 -
 85
85 -
 86
86 -
 87
87 -
 88
88 -
89
-
90
-
91
-
92
-
93
-
94
-
95
-
96
-
97
-
98
-
99
-
100
-
101
-
102
-
103
-
104
-
105
-
106
-
107
-
108
-
109
-
110
-
111
-
112
-
113
-
114
-
115
-
116
-
117
-
118
-
119
-
120
-
121
-
122
-
123
-
124
-
125
-
126
-
127
-
128
-
129
-
130
-
131
-
132
-
133
-
134
-
135
-
136
-
137
-
138
-
139
-
140
-
141
-
142
-
143
-
144
-
145
-
146
-
147
-
148
-
149
-
150
-
151
-
152
-
153
-
154
-
155
-
156
-
157
-
158
-
159
-
160
-
161
-
162
-
163
-
164
-
165
-
166
-
167
-
168
-
169
-
170
-
171
-
172
-
173
-
174
-
175
-
176
-
177
-
178
-
179
-
180
 |
 |
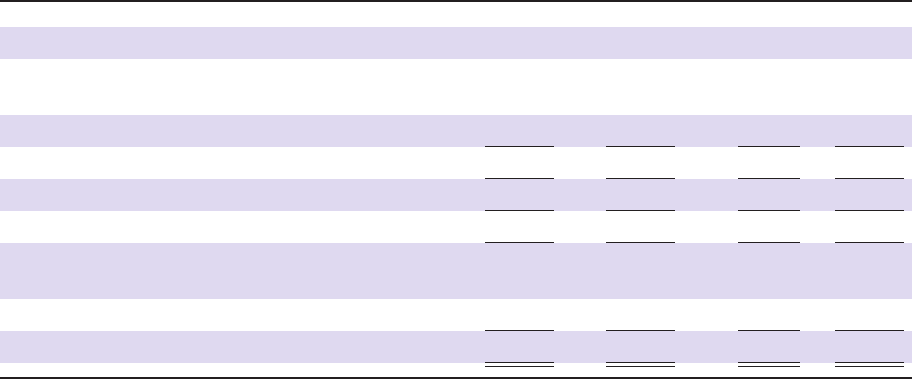
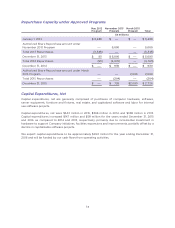
Repurchase Capacity under Approved Programs
May 2012
Program
November 2013
Program
March 2015
Program Total
(in millions)
January 1, 2013
$ 3,438 $ — $ — $ 3,438
Authorized Share Repurchase amount under
November 2013 Program
— 5,000 — 5,000
Total 2013 Repurchases
(3,345) — — (3,345)
December 31, 2013
$ 93 $ 5,000 $ — $ 5,093
Total 2014 Repurchases
(93) (4,070) — (4,163)
December 31, 2014
$ — $ 930 $ — $ 930
Authorized Share Repurchase amount under March
2015 Program
— — 2,000 2,000
Total 2015 Repurchases
— (204) — (204)
December 31, 2015
$ — $ 726 $2,000 $ 2,726
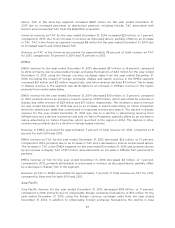
Capital Expenditures, Net
Capital expenditures, net are generally comprised of purchases of computer hardware, software,
server equipment, furniture and fixtures, real estate, and capitalized software and labor for internal
use software projects.
Capital expenditures, net were $543 million in 2015, $396 million in 2014, and $338 million in 2013.
Capital expenditures increased $147 million and $58 million for the years ended December 31, 2015
and 2014, as compared to 2014 and 2013, respectively, primarily due to incremental investment in
hardware to support Company initiatives, facilities expansions and improvements, partially offset by a
decline in capitalizable software projects.
We expect capital expenditures to be approximately $450 million for the year ending December 31,
2016 and will be funded by our cash flows from operating activities.
74