Yahoo 2015 Annual Report Download - page 46
Download and view the complete annual report
Please find page 46 of the 2015 Yahoo annual report below. You can navigate through the pages in the report by either clicking on the pages listed below, or by using the keyword search tool below to find specific information within the annual report.-
 1
1 -
2
-
3
-
4
-
5
-
6
-
7
-
8
-
9
-
10
-
11
-
12
-
13
-
14
-
15
-
16
-
17
-
18
-
19
-
20
-
21
-
22
-
23
-
24
-
25
-
26
-
27
-
28
-
29
-
30
-
31
-
32
-
33
-
34
-
35
-
 36
36 -
 37
37 -
 38
38 -
 39
39 -
 40
40 -
 41
41 -
 42
42 -
 43
43 -
 44
44 -
 45
45 -
 46
46 -
 47
47 -
 48
48 -
 49
49 -
 50
50 -
 51
51 -
 52
52 -
 53
53 -
 54
54 -
 55
55 -
 56
56 -
57
-
58
-
59
-
60
-
61
-
62
-
63
-
64
-
65
-
66
-
67
-
68
-
69
-
70
-
71
-
72
-
73
-
74
-
75
-
76
-
77
-
78
-
79
-
80
-
81
-
82
-
83
-
84
-
85
-
86
-
87
-
88
-
89
-
90
-
91
-
92
-
93
-
94
-
95
-
96
-
97
-
98
-
99
-
100
-
101
-
102
-
103
-
104
-
105
-
106
-
107
-
108
-
109
-
110
-
111
-
112
-
113
-
114
-
115
-
116
-
117
-
118
-
119
-
120
-
121
-
122
-
123
-
124
-
125
-
126
-
127
-
128
-
129
-
130
-
131
-
132
-
133
-
134
-
135
-
136
-
137
-
138
-
139
-
140
-
141
-
142
-
143
-
144
-
145
-
146
-
147
-
148
-
149
-
150
-
151
-
152
-
153
-
154
-
155
-
156
-
157
-
158
-
159
-
160
-
161
-
162
-
163
-
164
-
165
-
166
-
167
-
168
-
169
-
170
-
171
-
172
-
173
-
174
-
175
-
176
-
177
-
178
-
179
-
180
 |
 |

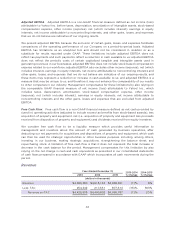
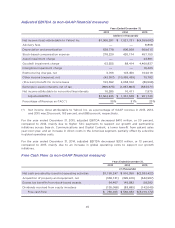
Adjusted EBITDA. Adjusted EBITDA is a non-GAAP financial measure defined as net income (loss)
attributable to Yahoo! Inc. before taxes, depreciation, amortization of intangible assets, stock-based
compensation expense, other income (expense), net (which includes interest), earnings in equity
interests, net income attributable to noncontrolling interests, and other gains, losses, and expenses
that we do not believe are indicative of our ongoing results.
We present adjusted EBITDA because the exclusion of certain gains, losses, and expenses facilitates
comparisons of the operating performance of our Company on a period-to-period basis. Adjusted
EBITDA has limitations as an analytical tool and should not be considered in isolation or as a
substitute for results reported under GAAP. These limitations include: adjusted EBITDA does not
reflect tax payments and such payments reflect a reduction in cash available to us; adjusted EBITDA
does not reflect the periodic costs of certain capitalized tangible and intangible assets used in
generating revenues in our businesses; adjusted EBITDA does not include stock-based compensation
expense related to our workforce; adjusted EBITDA also excludes other income (expense), net (which
includes interest), earnings in equity interests, net income attributable to noncontrolling interests and
other gains, losses, and expenses that we do not believe are indicative of our ongoing results, and
these items may represent a reduction or increase in cash available to us; and adjusted EBITDA is a
measure that may be unique to us, and therefore it may not enhance the comparability of our results
to other companies in our industry. Management compensates for these limitations by also relying on
the comparable GAAP financial measure of net income (loss) attributable to Yahoo! Inc., which
includes taxes, depreciation, amortization, stock-based compensation expense, other income
(expense), net (which includes interest), earnings in equity interests, net income attributable to
noncontrolling interests and the other gains, losses and expenses that are excluded from adjusted
EBITDA.
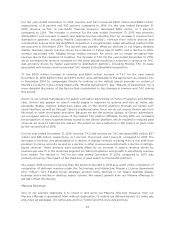
Free Cash Flow. Free cash flow is a non-GAAP financial measure defined as net cash provided by
(used in) operating activities (adjusted to include excess tax benefits from stock-based awards), less
acquisition of property and equipment, net (i.e., acquisition of property and equipment less proceeds
received from disposition of property and equipment) and dividends received from equity investees.
We consider free cash flow to be a liquidity measure which provides useful information to
management and investors about the amount of cash generated by business operations, after
deducting our net payments for acquisitions and dispositions of property and equipment, which cash
can then be used for strategic opportunities or other business purposes including, among others,
investing in our business, making strategic acquisitions, strengthening the balance sheet, and
repurchasing stock. A limitation of free cash flow is that it does not represent the total increase or
decrease in the cash balance for the period. Management compensates for this limitation by also
relying on the net change in cash and cash equivalents as presented in our consolidated statements
of cash flows prepared in accordance with GAAP which incorporates all cash movements during the
period.
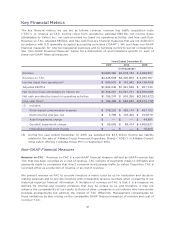
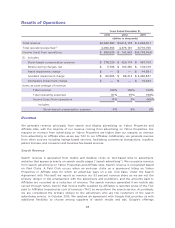
Revenue
Years Ended December 31, 2013-2014
% Change
2014-2015
% Change2013 2014 2015
(dollars in thousands)
Revenue
$4,680,380 $4,618,133 $4,968,301 (1)% 8%
Less: TAC
254,442 217,531 877,514 (15)% 303%
Revenue ex-TAC
$4,425,938 $4,400,602 $4,090,787 (1)% (7)%
42