Yahoo 2015 Annual Report Download - page 61
Download and view the complete annual report
Please find page 61 of the 2015 Yahoo annual report below. You can navigate through the pages in the report by either clicking on the pages listed below, or by using the keyword search tool below to find specific information within the annual report.-
 1
1 -
2
-
3
-
4
-
5
-
6
-
7
-
8
-
9
-
10
-
11
-
12
-
13
-
14
-
15
-
16
-
17
-
18
-
19
-
20
-
21
-
22
-
23
-
24
-
25
-
26
-
27
-
28
-
29
-
30
-
31
-
32
-
33
-
34
-
35
-
36
-
37
-
38
-
39
-
40
-
41
-
42
-
43
-
44
-
45
-
46
-
47
-
48
-
49
-
50
-
 51
51 -
 52
52 -
 53
53 -
 54
54 -
 55
55 -
 56
56 -
 57
57 -
 58
58 -
 59
59 -
 60
60 -
 61
61 -
 62
62 -
 63
63 -
 64
64 -
 65
65 -
 66
66 -
 67
67 -
 68
68 -
 69
69 -
 70
70 -
 71
71 -
72
-
73
-
74
-
75
-
76
-
77
-
78
-
79
-
80
-
81
-
82
-
83
-
84
-
85
-
86
-
87
-
88
-
89
-
90
-
91
-
92
-
93
-
94
-
95
-
96
-
97
-
98
-
99
-
100
-
101
-
102
-
103
-
104
-
105
-
106
-
107
-
108
-
109
-
110
-
111
-
112
-
113
-
114
-
115
-
116
-
117
-
118
-
119
-
120
-
121
-
122
-
123
-
124
-
125
-
126
-
127
-
128
-
129
-
130
-
131
-
132
-
133
-
134
-
135
-
136
-
137
-
138
-
139
-
140
-
141
-
142
-
143
-
144
-
145
-
146
-
147
-
148
-
149
-
150
-
151
-
152
-
153
-
154
-
155
-
156
-
157
-
158
-
159
-
160
-
161
-
162
-
163
-
164
-
165
-
166
-
167
-
168
-
169
-
170
-
171
-
172
-
173
-
174
-
175
-
176
-
177
-
178
-
179
-
180
 |
 |

benefits in 2015, $14 million in depreciation and amortization expense, travel and entertainment
expense of $4 million and marketing and public relations expense of $4 million. These increases in
general and administrative expenses were partially offset by declines in facilities and equipment
expense of $16 million, outside service provider expense of $16 million and compensation costs of
$14 million. The decline in compensation costs was primarily attributable to a 19 percent decline in
headcount year-over-year.
General and administrative expenses for the year ended December 31, 2014 increased $19 million, or 3
percent, compared to 2013, due to increases in stock-based compensation expense of $16 million,
outside service provider expense of $3 million, facilities and equipment expense of $16 million, and
compensation costs of $2 million. These increases were partially offset by a decline in depreciation
and amortization expense of $4 million, benefits related to net gains on disposal of assets of $9
million and business tax refunds received of $6 million. The increase in stock-based compensation
expense for the year ended December 31, 2014 was attributable to an increase in the number of
awards being expensed at a higher fair value.
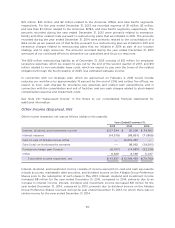
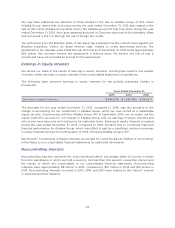
Amortization of Intangibles
We have purchased, and expect to continue purchasing, assets and/or businesses, which may include
the purchase of intangible assets. Intangible assets include customer, affiliate, and advertiser-related
relationships and tradenames, trademarks and domain names. Amortization of developed technology
and patents is included in the cost of revenue—other, and not in amortization of intangibles.
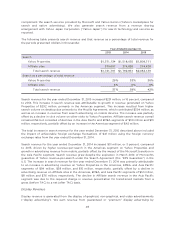
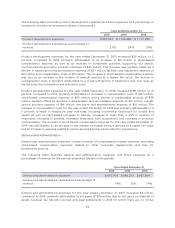
The following table presents amortization of intangibles and those expenses as a percentage of
revenue for the periods presented (dollars in thousands):
Years Ended December 31,
2013 2014 2015
Amortization of intangibles
$ 44,841 $ 66,750 $ 79,042
Amortization of intangibles as a percentage of revenue
1% 2% 2%
Amortization of intangibles for the year ended December 31, 2015 increased $12 million, or 18 percent,
compared to 2014, primarily driven by incremental amortization of intangible assets related to
BrightRoll, which we acquired in the fourth quarter of 2014, as well as incremental amortization of
intangibles assets related to companies acquired in 2015.
Amortization of intangibles for the year ended December 31, 2014 increased $22 million, or 49
percent, compared to 2013, primarily driven by amortization of intangible assets related to Tumblr,
which we acquired in the second quarter of 2013.
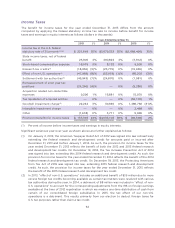
Gain on Sales of Patents
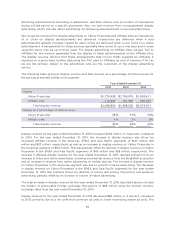
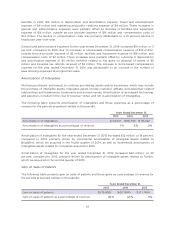
The following table presents gain on sales of patents and those gains as a percentage of revenue for
the periods presented (dollars in thousands):
Years Ended December 31,
2013 2014 2015
Gain on sales of patents
$ (79,950) $ (97,894) $ (11,100)
Gain on sales of patents as a percentage of revenue
(2)% (2)% 0%
57