Yahoo 2015 Annual Report Download - page 75
Download and view the complete annual report
Please find page 75 of the 2015 Yahoo annual report below. You can navigate through the pages in the report by either clicking on the pages listed below, or by using the keyword search tool below to find specific information within the annual report.-
 1
1 -
2
-
3
-
4
-
5
-
6
-
7
-
8
-
9
-
10
-
11
-
12
-
13
-
14
-
15
-
16
-
17
-
18
-
19
-
20
-
21
-
22
-
23
-
24
-
25
-
26
-
27
-
28
-
29
-
30
-
31
-
32
-
33
-
34
-
35
-
36
-
37
-
38
-
39
-
40
-
41
-
42
-
43
-
44
-
45
-
46
-
47
-
48
-
49
-
50
-
51
-
52
-
53
-
54
-
55
-
56
-
57
-
58
-
59
-
60
-
61
-
62
-
63
-
64
-
 65
65 -
 66
66 -
 67
67 -
 68
68 -
 69
69 -
 70
70 -
 71
71 -
 72
72 -
 73
73 -
 74
74 -
 75
75 -
 76
76 -
 77
77 -
 78
78 -
 79
79 -
 80
80 -
 81
81 -
 82
82 -
 83
83 -
 84
84 -
 85
85 -
86
-
87
-
88
-
89
-
90
-
91
-
92
-
93
-
94
-
95
-
96
-
97
-
98
-
99
-
100
-
101
-
102
-
103
-
104
-
105
-
106
-
107
-
108
-
109
-
110
-
111
-
112
-
113
-
114
-
115
-
116
-
117
-
118
-
119
-
120
-
121
-
122
-
123
-
124
-
125
-
126
-
127
-
128
-
129
-
130
-
131
-
132
-
133
-
134
-
135
-
136
-
137
-
138
-
139
-
140
-
141
-
142
-
143
-
144
-
145
-
146
-
147
-
148
-
149
-
150
-
151
-
152
-
153
-
154
-
155
-
156
-
157
-
158
-
159
-
160
-
161
-
162
-
163
-
164
-
165
-
166
-
167
-
168
-
169
-
170
-
171
-
172
-
173
-
174
-
175
-
176
-
177
-
178
-
179
-
180
 |
 |
See Note 2—“Marketable Securities, Investments and Fair Value Disclosures” in the Notes to our
consolidated financial statements for additional information.
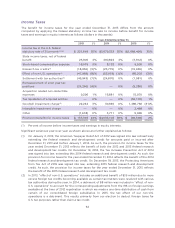
Cash Flow Changes
Net cash provided (used in) by operating activities.
Cash provided by (used in) operating activities is driven by our net income (loss), adjusted for non-
cash items, working capital changes and dividends received from equity investees. Non-cash
adjustments include depreciation, amortization of intangible assets, accretion of convertible notes
discount, stock-based compensation expense, non-cash restructuring charges, non-cash asset
impairment charges, non-cash goodwill impairment charges, non-cash intangibles impairment
charges, tax benefits from stock-based awards, excess tax benefits from stock-based awards,
deferred income taxes, earnings in equity interests, and gain on sales of patents.
Cash flows from operating activities for the year ended December 31, 2015 was reduced by a net loss
of $4,351 million, changes in working capital of $3,445 million (which included the reduction of the
income tax liability related to the sale of Alibaba Group shares in September 2014) and earnings in
equity interests of $384 million offset by non-cash goodwill and other impairment charges of
$4,521 million, other non-cash adjustments of $1,134 million, and dividends from equity investees of
$142 million.
For the year ended December 31, 2014, operating activities provided $916 million in cash. Net income
for the year ended December 31, 2014 was $7,532 million, which was offset by the gain on sale of
Alibaba Group ADSs of $10,319 million and earnings in equity interests of $1,058 million. Additionally,
we received dividends from equity investees of $84 million, incurred non-cash adjustments of $1,473
million and had a net source of cash from working capital of $3,204 million which included the
income tax liability related to the sale of Alibaba Group shares in September 2014.
For the year ended December 31, 2013, operating activities provided $1,195 million in cash. Net
income for the year ended December 31, 2013 was $1,377 million, which was offset by earnings in
equity interests of $897 million and a net use of cash from working capital of $203 million.
Additionally, we had non-cash adjustments of $783 million and received dividends of $135 million
from equity investees.
Net cash (used in) provided by investing activities.
Cash (used in) provided by investing activities is primarily attributable to sales and maturities of
marketable securities, sales of our strategic investments or settlement of derivative hedge contracts,
acquisitions, purchases of marketable securities, capital expenditures, and purchases of intangible
assets.
In the year ended December 31, 2015, the $1,752 million provided by investing activities was due to
proceeds from sales and maturities of marketable securities, net of purchases, of $2,308 million, $29
million in proceeds from the sale of patents, and $138 million in net proceeds from settlement of
derivative hedge contracts, partially offset by $543 million used for capital expenditures, net, $176
million used for acquisitions, and $4 million used for the purchase of intangibles and other activities.
During the year ended December 31, 2014, the $3.7 billion provided by investing activities was due to
$9.4 billion in cash proceeds from the sale of Alibaba Group ADSs, net of underwriting discounts, fees
71