Yahoo 2015 Annual Report Download - page 92
Download and view the complete annual report
Please find page 92 of the 2015 Yahoo annual report below. You can navigate through the pages in the report by either clicking on the pages listed below, or by using the keyword search tool below to find specific information within the annual report.-
 1
1 -
2
-
3
-
4
-
5
-
6
-
7
-
8
-
9
-
10
-
11
-
12
-
13
-
14
-
15
-
16
-
17
-
18
-
19
-
20
-
21
-
22
-
23
-
24
-
25
-
26
-
27
-
28
-
29
-
30
-
31
-
32
-
33
-
34
-
35
-
36
-
37
-
38
-
39
-
40
-
41
-
42
-
43
-
44
-
45
-
46
-
47
-
48
-
49
-
50
-
51
-
52
-
53
-
54
-
55
-
56
-
57
-
58
-
59
-
60
-
61
-
62
-
63
-
64
-
65
-
66
-
67
-
68
-
69
-
70
-
71
-
72
-
73
-
74
-
75
-
76
-
77
-
78
-
79
-
80
-
81
-
 82
82 -
 83
83 -
 84
84 -
 85
85 -
 86
86 -
 87
87 -
 88
88 -
 89
89 -
 90
90 -
 91
91 -
 92
92 -
 93
93 -
 94
94 -
 95
95 -
 96
96 -
 97
97 -
 98
98 -
 99
99 -
 100
100 -
 101
101 -
 102
102 -
103
-
104
-
105
-
106
-
107
-
108
-
109
-
110
-
111
-
112
-
113
-
114
-
115
-
116
-
117
-
118
-
119
-
120
-
121
-
122
-
123
-
124
-
125
-
126
-
127
-
128
-
129
-
130
-
131
-
132
-
133
-
134
-
135
-
136
-
137
-
138
-
139
-
140
-
141
-
142
-
143
-
144
-
145
-
146
-
147
-
148
-
149
-
150
-
151
-
152
-
153
-
154
-
155
-
156
-
157
-
158
-
159
-
160
-
161
-
162
-
163
-
164
-
165
-
166
-
167
-
168
-
169
-
170
-
171
-
172
-
173
-
174
-
175
-
176
-
177
-
178
-
179
-
180
 |
 |

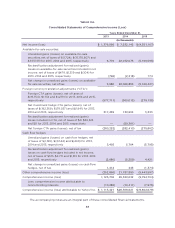
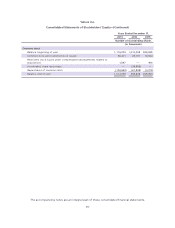
Yahoo! Inc.
Consolidated Statements of Comprehensive Income (Loss)
Years Ended December 31,
2013 2014 2015
(in thousands)
Net income (loss)
$ 1,376,566 $ 7,532,142 $ (4,351,107)
Available-for-sale securities:
Unrealized gains (losses) on available-for-sale
securities, net of taxes of $(1,724), $(15,170,607) and
$3,551,551 for 2013, 2014 and 2015, respectively
6,776 22,072,073 (5,166,595)
Reclassification adjustment for realized (gains)
losses on available-for-sale securities included in net
income, net of taxes of $479, $1,339 and $(104) for
2013, 2014 and 2015, respectively
(796) (2,218) 174
Net change in unrealized gains (losses) on available-
for-sale securities, net of tax
5,980 22,069,855 (5,166,421)
Foreign currency translation adjustments (“CTA”):
Foreign CTA gains (losses), net of taxes of
$(19,754), $1,734 and $1,279 for 2013, 2014 and 2015,
respectively
(577,711) (363,013) (279,135)
Net investment hedge CTA gains (losses), net of
taxes of $(192,369), $(79,037) and $(1,941) for 2013,
2014 and 2015, respectively
317,459 130,904 3,333
Reclassification adjustment for realized (gains)
losses included in CTA, net of taxes of $0, $30,325
and $0 for 2013, 2014, and 2015, respectively
— (50,301) —
Net foreign CTA gains (losses), net of tax
(260,252) (282,410) (275,802)
Cash flow hedges:
Unrealized gains (losses) on cash flow hedges, net
of taxes of $(1,199), $(3,044) and $(490) for 2013,
2014 and 2015, respectively
3,492 5,704 (5,795)
Reclassification adjustment for realized (gains)
losses on cash flow hedges included in net income,
net of taxes of $575, $2,771 and $1,319 for 2013, 2014
and 2015, respectively
(2,080) (5,259) 4,421
Net change in unrealized gains (losses) on cash flow
hedges, net of tax
1,412 445 (1,374)
Other comprehensive income (loss)
(252,860) 21,787,890 (5,443,597)
Comprehensive income (loss)
1,123,706 29,320,032 (9,794,704)
Less: comprehensive income attributable to
noncontrolling interests
(10,285) (10,411) (7,975)
Comprehensive income (loss) attributable to Yahoo! Inc.
$ 1,113,421 $29,309,621 $ (9,802,679)
The accompanying notes are an integral part of these consolidated financial statements.
88