Yahoo 2015 Annual Report Download - page 64
Download and view the complete annual report
Please find page 64 of the 2015 Yahoo annual report below. You can navigate through the pages in the report by either clicking on the pages listed below, or by using the keyword search tool below to find specific information within the annual report.-
 1
1 -
2
-
3
-
4
-
5
-
6
-
7
-
8
-
9
-
10
-
11
-
12
-
13
-
14
-
15
-
16
-
17
-
18
-
19
-
20
-
21
-
22
-
23
-
24
-
25
-
26
-
27
-
28
-
29
-
30
-
31
-
32
-
33
-
34
-
35
-
36
-
37
-
38
-
39
-
40
-
41
-
42
-
43
-
44
-
45
-
46
-
47
-
48
-
49
-
50
-
51
-
52
-
53
-
 54
54 -
 55
55 -
 56
56 -
 57
57 -
 58
58 -
 59
59 -
 60
60 -
 61
61 -
 62
62 -
 63
63 -
 64
64 -
 65
65 -
 66
66 -
 67
67 -
 68
68 -
 69
69 -
 70
70 -
 71
71 -
 72
72 -
 73
73 -
 74
74 -
75
-
76
-
77
-
78
-
79
-
80
-
81
-
82
-
83
-
84
-
85
-
86
-
87
-
88
-
89
-
90
-
91
-
92
-
93
-
94
-
95
-
96
-
97
-
98
-
99
-
100
-
101
-
102
-
103
-
104
-
105
-
106
-
107
-
108
-
109
-
110
-
111
-
112
-
113
-
114
-
115
-
116
-
117
-
118
-
119
-
120
-
121
-
122
-
123
-
124
-
125
-
126
-
127
-
128
-
129
-
130
-
131
-
132
-
133
-
134
-
135
-
136
-
137
-
138
-
139
-
140
-
141
-
142
-
143
-
144
-
145
-
146
-
147
-
148
-
149
-
150
-
151
-
152
-
153
-
154
-
155
-
156
-
157
-
158
-
159
-
160
-
161
-
162
-
163
-
164
-
165
-
166
-
167
-
168
-
169
-
170
-
171
-
172
-
173
-
174
-
175
-
176
-
177
-
178
-
179
-
180
 |
 |
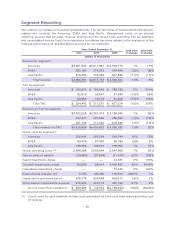
$76 million, $25 million, and $2 million related to the Americas, EMEA, and Asia Pacific segments,
respectively. For the year ended December 31, 2013, we recorded expense of $1 million, $3 million,
and less than $1 million related to the Americas, EMEA, and Asia Pacific segments, respectively. The
amounts recorded during the year ended December 31, 2015 were primarily related to severance,
facility and other related costs pursuant to restructuring plans that we initiated in 2015. The amounts
recorded during the year ended December 31, 2014 were primarily related to the consolidation of a
data center as we ceased use of that facility pursuant to a restructuring plan we initiated in 2011 and
severance charges related to restructuring plans that we initiated in 2014 as part of our location
strategy and to align resources. The amounts recorded during the year ended December 31, 2013
were part of our continued efforts to streamline our operations and focus our resources.
The $66 million restructuring liability as of December 31, 2015 consists of $15 million for employee
severance expenses, which we expect to pay out by the end of the second quarter of 2017, and $51
million related to non-cancelable lease costs, which we expect to pay over the terms of the related
obligations through the fourth quarter of 2025, less estimated sublease income.
In connection with our strategic plan, which we announced on February 2, 2016 would include
reducing our workforce by approximately 15 percent by the end of 2016 and exiting five offices, we
expect to incur cash charges for severance pay expenses and related cash expenditures, and in
connection with the consolidation and exit of facilities, and non-cash charges related to stock-based
compensation expense and impairment costs.
See Note 20—“Subsequent Events” in the Notes to our consolidated financial statements for
additional information.
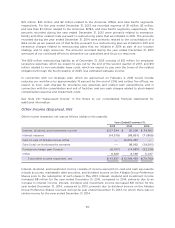
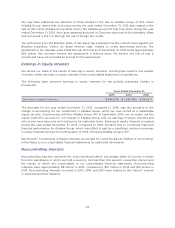
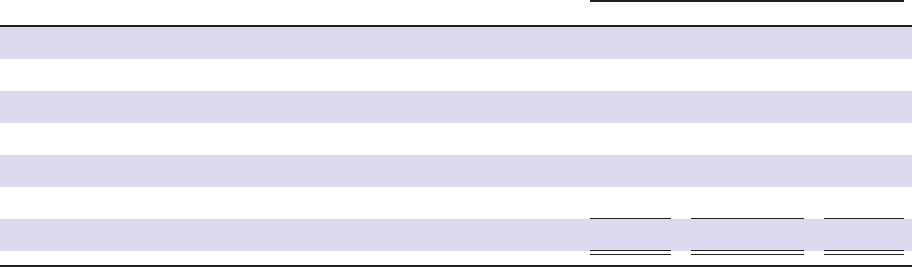
Other Income (Expense), Net
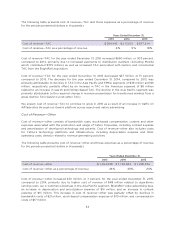
Other income (expense), net was as follows (dollars in thousands):
Years Ended December 31,
2013 2014 2015
Interest, dividend, and investment income
$ 57,544 $ 26,309 $ 34,383
Interest expense
(14,319) (68,851) (71,865)
Gain on sale of Alibaba Group ADSs
— 10,319,437 —
Gain (loss) on Hortonworks warrants
— 98,062 (19,201)
Foreign exchange gain (losses)
(6,197) (14,687) (22,226)
Other
6,329 9,169 3,127
Total other income (expense), net
$ 43,357 $10,369,439 $(75,782)
Interest, dividend, and investment income consists of income earned from cash and cash equivalents
in bank accounts, marketable debt securities, and dividend income on the Alibaba Group Preference
Shares prior to the redemption of such shares in May 2013. Interest, dividend and investment income
increased $8 million for the year ended December 31, 2015, compared to 2014, primarily due to an
increase in interest income. Interest, dividend, and investment income decreased $31 million for the
year ended December 31, 2014, compared to 2013, primarily due to dividend income on the Alibaba
Group Preference Shares received during the year ended December 31, 2013, for which there was no
similar income for the year ended December 31, 2014.
60