Yahoo 2015 Annual Report Download - page 60
Download and view the complete annual report
Please find page 60 of the 2015 Yahoo annual report below. You can navigate through the pages in the report by either clicking on the pages listed below, or by using the keyword search tool below to find specific information within the annual report.-
 1
1 -
2
-
3
-
4
-
5
-
6
-
7
-
8
-
9
-
10
-
11
-
12
-
13
-
14
-
15
-
16
-
17
-
18
-
19
-
20
-
21
-
22
-
23
-
24
-
25
-
26
-
27
-
28
-
29
-
30
-
31
-
32
-
33
-
34
-
35
-
36
-
37
-
38
-
39
-
40
-
41
-
42
-
43
-
44
-
45
-
46
-
47
-
48
-
49
-
 50
50 -
 51
51 -
 52
52 -
 53
53 -
 54
54 -
 55
55 -
 56
56 -
 57
57 -
 58
58 -
 59
59 -
 60
60 -
 61
61 -
 62
62 -
 63
63 -
 64
64 -
 65
65 -
 66
66 -
 67
67 -
 68
68 -
 69
69 -
 70
70 -
71
-
72
-
73
-
74
-
75
-
76
-
77
-
78
-
79
-
80
-
81
-
82
-
83
-
84
-
85
-
86
-
87
-
88
-
89
-
90
-
91
-
92
-
93
-
94
-
95
-
96
-
97
-
98
-
99
-
100
-
101
-
102
-
103
-
104
-
105
-
106
-
107
-
108
-
109
-
110
-
111
-
112
-
113
-
114
-
115
-
116
-
117
-
118
-
119
-
120
-
121
-
122
-
123
-
124
-
125
-
126
-
127
-
128
-
129
-
130
-
131
-
132
-
133
-
134
-
135
-
136
-
137
-
138
-
139
-
140
-
141
-
142
-
143
-
144
-
145
-
146
-
147
-
148
-
149
-
150
-
151
-
152
-
153
-
154
-
155
-
156
-
157
-
158
-
159
-
160
-
161
-
162
-
163
-
164
-
165
-
166
-
167
-
168
-
169
-
170
-
171
-
172
-
173
-
174
-
175
-
176
-
177
-
178
-
179
-
180
 |
 |

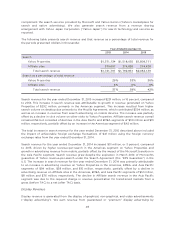
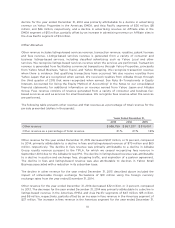
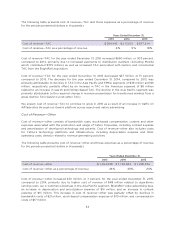
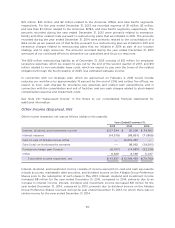
The following table presents product development expenses and those expenses as a percentage of
revenue for the periods presented (dollars in thousands):
Years Ended December 31,
2013 2014 2015
Product development expenses
$ 957,587 $ 1,156,386 $ 1,177,923
Product development expenses as a percentage of
revenue
21% 24% 24%
Product development expenses for the year ended December 31, 2015 increased $22 million, or 2
percent, compared to 2014, primarily attributable to an increase of $51 million in stock-based
compensation expense, as well as an increase in investment activities supporting our search,
communications and other product initiatives of $35 million. This increase was partially offset by a
decline in depreciation and amortization expense of $37 million, facilities and equipment expense of
$15 million and compensation costs of $11 million. The increase in stock-based compensation expense
was due to an increase in the number of awards granted at a higher fair value. The decline in
compensation costs is primarily attributable to a 17 percent decline in headcount year-over-year, as
well as a decline in transition and relocation costs.
Product development expenses for the year ended December 31, 2014 increased $199 million, or 21
percent, compared to 2013, primarily attributable to increases in compensation costs of $141 million,
stock-based compensation expense of $56 million, and a decline in capitalizable projects of $38
million, partially offset by declines in depreciation and amortization expense of $12 million, outside
service provider expense of $14 million, and travel and entertainment expense of $10 million. The
increase in compensation costs for the year ended December 31, 2014 was primarily attributable to a
6 percent increase in headcount year-over-year, including incremental headcount for mobile and
search as well as merit-based increases in salaries, increases in costs from a shift in location of
employees, increases in benefits, increased headcount from acquisitions, and increases in incentive
compensation. The increase in stock-based compensation expense for the year ended December 31,
2014 was attributable to an increase in the number of awards being expensed at a higher fair value
and an increase in expense related to equity assumed and granted related to acquisitions.
General and Administrative
General and administrative expenses consist primarily of compensation-related expenses (including
stock-based compensation expense) related to other corporate departments and fees for
professional services.
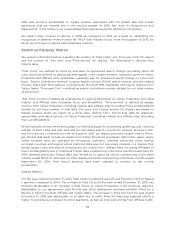
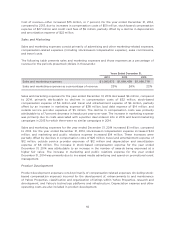
The following table presents general and administrative expenses and those expenses as a
percentage of revenue for the periods presented (dollars in thousands):
Years Ended December 31,
2013 2014 2015
General and administrative expenses
$ 667,403 $ 686,272 $ 687,804
General and administrative expenses as a percentage of
revenue
14% 15% 14%
General and administrative expenses for the year ended December 31, 2015 increased $2 million,
compared to 2014, primarily attributable to increases of $26 million due to net gains on disposal of
assets, business tax refunds received and legal settlements in 2014 for which there are no similar
56