Yahoo 2015 Annual Report Download - page 96
Download and view the complete annual report
Please find page 96 of the 2015 Yahoo annual report below. You can navigate through the pages in the report by either clicking on the pages listed below, or by using the keyword search tool below to find specific information within the annual report.-
 1
1 -
2
-
3
-
4
-
5
-
6
-
7
-
8
-
9
-
10
-
11
-
12
-
13
-
14
-
15
-
16
-
17
-
18
-
19
-
20
-
21
-
22
-
23
-
24
-
25
-
26
-
27
-
28
-
29
-
30
-
31
-
32
-
33
-
34
-
35
-
36
-
37
-
38
-
39
-
40
-
41
-
42
-
43
-
44
-
45
-
46
-
47
-
48
-
49
-
50
-
51
-
52
-
53
-
54
-
55
-
56
-
57
-
58
-
59
-
60
-
61
-
62
-
63
-
64
-
65
-
66
-
67
-
68
-
69
-
70
-
71
-
72
-
73
-
74
-
75
-
76
-
77
-
78
-
79
-
80
-
81
-
82
-
83
-
84
-
85
-
 86
86 -
 87
87 -
 88
88 -
 89
89 -
 90
90 -
 91
91 -
 92
92 -
 93
93 -
 94
94 -
 95
95 -
 96
96 -
 97
97 -
 98
98 -
 99
99 -
 100
100 -
 101
101 -
 102
102 -
 103
103 -
 104
104 -
 105
105 -
 106
106 -
107
-
108
-
109
-
110
-
111
-
112
-
113
-
114
-
115
-
116
-
117
-
118
-
119
-
120
-
121
-
122
-
123
-
124
-
125
-
126
-
127
-
128
-
129
-
130
-
131
-
132
-
133
-
134
-
135
-
136
-
137
-
138
-
139
-
140
-
141
-
142
-
143
-
144
-
145
-
146
-
147
-
148
-
149
-
150
-
151
-
152
-
153
-
154
-
155
-
156
-
157
-
158
-
159
-
160
-
161
-
162
-
163
-
164
-
165
-
166
-
167
-
168
-
169
-
170
-
171
-
172
-
173
-
174
-
175
-
176
-
177
-
178
-
179
-
180
 |
 |

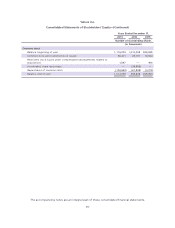
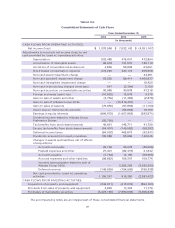
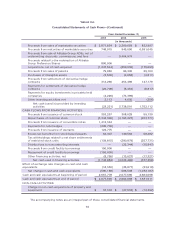
Yahoo! Inc.
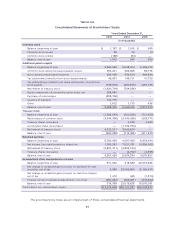
Consolidated Statements of Cash Flows—(Continued)
Years Ended December 31,
2013 2014 2015
(in thousands)
Proceeds from sales of marketable securities
$ 2,871,834 $ 2,269,659 $ 822,997
Proceeds from maturities of marketable securities
748,915 945,696 6,691,645
Proceeds from sale of Alibaba Group ADSs, net of
underwriting discounts, commissions, and fees
— 9,404,974 —
Proceeds related to the redemption of Alibaba
Group Preference Shares
800,000 — —
Acquisitions, net of cash acquired
(1,247,544) (859,036) (175,693)
Proceeds from sales of patents
79,950 86,300 29,100
Purchases of intangible assets
(2,500) (2,658) (4,811)
Proceeds from settlement of derivative hedge
contracts
312,266 254,496 147,179
Payments for settlement of derivative hedge
contracts
(22,708) (5,454) (8,817)
Payments for equity investments in privately held
companies
(4,226) (74,399) —
Other investing activities, net
2,113 4,630 (256)
Net cash (used in) provided by investing
activities
(23,221) 3,738,501 1,752,112
CASH FLOWS FROM FINANCING ACTIVITIES:
Proceeds from issuance of common stock
353,267 308,029 59,130
Repurchases of common stock
(3,344,396) (4,163,227) (203,771)
Proceeds from issuance of convertible notes
1,412,344 — —
Payments for note hedges
(205,706) — —
Proceeds from issuance of warrants
124,775 — —
Excess tax benefits from stock-based awards
64,407 149,582 58,282
Tax withholdings related to net share settlements
of restricted stock units
(139,815) (280,879) (257,731)
Distributions to noncontrolling interests
— (22,344) (15,847)
Proceeds from credit facility borrowings
150,000 — —
Repayment of credit facility borrowings
(150,000) — —
Other financing activities, net
(8,760) (13,627) (17,321)
Net cash used in financing activities
(1,743,884) (4,022,466) (377,258)
Effect of exchange rate changes on cash and cash
equivalents
(18,330) (45,877) (23,619)
Net change in cash and cash equivalents
(590,188) 586,508 (1,032,187)
Cash and cash equivalents at beginning of period
2,667,778 2,077,590 2,664,098
Cash and cash equivalents at end of period
$ 2,077,590 $ 2,664,098 $ 1,631,911
NON-CASH ACTIVITIES:
Change in non-cash acquisitions of property and
equipment
$ 37,318 $ (27,533) $ (12,392)
The accompanying notes are an integral part of these consolidated financial statements.
92