Yahoo 2015 Annual Report Download - page 47
Download and view the complete annual report
Please find page 47 of the 2015 Yahoo annual report below. You can navigate through the pages in the report by either clicking on the pages listed below, or by using the keyword search tool below to find specific information within the annual report.-
 1
1 -
2
-
3
-
4
-
5
-
6
-
7
-
8
-
9
-
10
-
11
-
12
-
13
-
14
-
15
-
16
-
17
-
18
-
19
-
20
-
21
-
22
-
23
-
24
-
25
-
26
-
27
-
28
-
29
-
30
-
31
-
32
-
33
-
34
-
35
-
36
-
 37
37 -
 38
38 -
 39
39 -
 40
40 -
 41
41 -
 42
42 -
 43
43 -
 44
44 -
 45
45 -
 46
46 -
 47
47 -
 48
48 -
 49
49 -
 50
50 -
 51
51 -
 52
52 -
 53
53 -
 54
54 -
 55
55 -
 56
56 -
 57
57 -
58
-
59
-
60
-
61
-
62
-
63
-
64
-
65
-
66
-
67
-
68
-
69
-
70
-
71
-
72
-
73
-
74
-
75
-
76
-
77
-
78
-
79
-
80
-
81
-
82
-
83
-
84
-
85
-
86
-
87
-
88
-
89
-
90
-
91
-
92
-
93
-
94
-
95
-
96
-
97
-
98
-
99
-
100
-
101
-
102
-
103
-
104
-
105
-
106
-
107
-
108
-
109
-
110
-
111
-
112
-
113
-
114
-
115
-
116
-
117
-
118
-
119
-
120
-
121
-
122
-
123
-
124
-
125
-
126
-
127
-
128
-
129
-
130
-
131
-
132
-
133
-
134
-
135
-
136
-
137
-
138
-
139
-
140
-
141
-
142
-
143
-
144
-
145
-
146
-
147
-
148
-
149
-
150
-
151
-
152
-
153
-
154
-
155
-
156
-
157
-
158
-
159
-
160
-
161
-
162
-
163
-
164
-
165
-
166
-
167
-
168
-
169
-
170
-
171
-
172
-
173
-
174
-
175
-
176
-
177
-
178
-
179
-
180
 |
 |
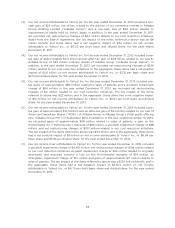
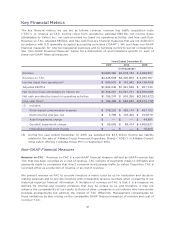
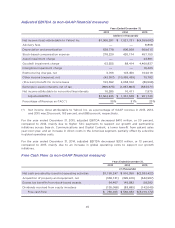
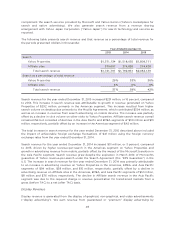
For the year ended December 31, 2015, revenue and TAC increased $350 million and $660 million,
respectively, or 8 percent and 303 percent, compared to 2014. For the year ended December 31,
2015, revenue ex-TAC (a non-GAAP financial measure) decreased $310 million, or 7 percent,
compared to 2014. The increase in revenue for the year ended December 31, 2015 was primarily
attributable to an increase in search and display revenue resulting from an increase in revenue from
distribution partners, including Mozilla Corporation (“Mozilla”), revenue from mobile devices and
incremental revenue from the BrightRoll acquisition, a programmatic video advertising platform that
we acquired in December 2014. This growth was partially offset by declines in our legacy desktop
display business, search revenue driven by a decline in Yahoo search traffic, and a decline in other
revenue associated with Alibaba Group royalty revenue, for which we no longer recognize fees
revenue due to the cessation of royalties. The increase in TAC for the year ended December 31, 2015,
which exceeded the revenue increases for the same period resulting in a decline in revenue ex-TAC,
was primarily driven by higher payments to distribution partners, including Mozilla, TAC increase
associated with Gemini, and incremental TAC related to the BrightRoll acquisition.
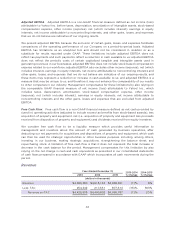
Of the $350 million increase in revenue and $660 million increase in TAC for the year ended
December 31, 2015, $394 million and $375 million were attributable to the agreement we entered into
in November 2014 to compensate Mozilla for making us the default search provider on certain of
Mozilla’s products in the United States (the “Mozilla Agreement”). See “Results of Operations” for a
more detailed discussion of the factors that contributed to the changes in revenue and TAC during
this period.
Gemini is our unified marketplace for search and native advertising on Yahoo Properties and Affiliate
sites. Gemini ads appear on search results pages in response to queries and also as native ads
alongside display content. Advertisers place ads on the Gemini platform through our simple self-
serve interface, as well as through Yahoo’s traditional sales force; we do not source Gemini ads from
Microsoft or other third-party providers. Because we are the primary obligor to Gemini advertisers,
we recognize Gemini revenue gross of the related TAC paid to Affiliates. During 2015, we increased
the proportion of search queries being routed to the Gemini platform, which resulted in reduced paid
clicks as we work to optimize the system. We expect to see a reduction in the impact on paid clicks
by the second half of 2016.
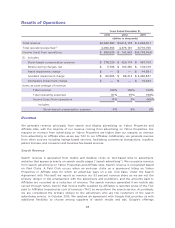
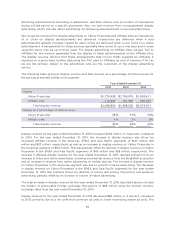
For the year ended December 31, 2014, revenue, TAC and revenue ex-TAC decreased $62 million, $37
million and $25 million, respectively, or 1 percent, 15 percent, and 1 percent, compared to 2013. The
decrease in revenue was attributable to a decline in display revenue resulting from a mix shift from
premium to native ad units, as well as a decline in other revenue associated with a decline in listings-
based revenue. These declines were partially offset by an increase in search revenue driven by
revenue-per-search in the Americas segment on Yahoo Properties and growth in advertising revenue
from mobile. The decline in TAC for the year ended December 31, 2014, compared to 2013, was
primarily driven by the impact of the transition of paid search to Microsoft’s platform.
We expect 2016 revenue to be less than the amount reported in 2015 as a result of the completion of
recognition of deferred revenue under the Technology and Intellectual Property License Agreement
(the “TIPLA”) with Alibaba Group, strategic product exits, declines in our legacy desktop display
business and a decline in desktop search volume. We expect growth from our Mavens offerings to
partially offset this decline.
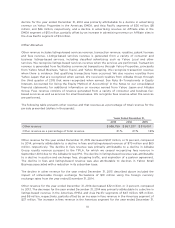
Mavens Revenue
One of our primary strategies is to invest in and grow our Mavens offerings. Revenue from our
Mavens offerings is generated from, without duplication, (i) mobile (as defined below), (ii) video ads
and video ad packages, (iii) native ads, and (iv) Tumblr and Polyvore ads and fees.
43