Yahoo 2015 Annual Report Download - page 145
Download and view the complete annual report
Please find page 145 of the 2015 Yahoo annual report below. You can navigate through the pages in the report by either clicking on the pages listed below, or by using the keyword search tool below to find specific information within the annual report.-
 1
1 -
2
-
3
-
4
-
5
-
6
-
7
-
8
-
9
-
10
-
11
-
12
-
13
-
14
-
15
-
16
-
17
-
18
-
19
-
20
-
21
-
22
-
23
-
24
-
25
-
26
-
27
-
28
-
29
-
30
-
31
-
32
-
33
-
34
-
35
-
36
-
37
-
38
-
39
-
40
-
41
-
42
-
43
-
44
-
45
-
46
-
47
-
48
-
49
-
50
-
51
-
52
-
53
-
54
-
55
-
56
-
57
-
58
-
59
-
60
-
61
-
62
-
63
-
64
-
65
-
66
-
67
-
68
-
69
-
70
-
71
-
72
-
73
-
74
-
75
-
76
-
77
-
78
-
79
-
80
-
81
-
82
-
83
-
84
-
85
-
86
-
87
-
88
-
89
-
90
-
91
-
92
-
93
-
94
-
95
-
96
-
97
-
98
-
99
-
100
-
101
-
102
-
103
-
104
-
105
-
106
-
107
-
108
-
109
-
110
-
111
-
112
-
113
-
114
-
115
-
116
-
117
-
118
-
119
-
120
-
121
-
122
-
123
-
124
-
125
-
126
-
127
-
128
-
129
-
130
-
131
-
132
-
133
-
134
-
 135
135 -
 136
136 -
 137
137 -
 138
138 -
 139
139 -
 140
140 -
 141
141 -
 142
142 -
 143
143 -
 144
144 -
 145
145 -
 146
146 -
 147
147 -
 148
148 -
 149
149 -
 150
150 -
 151
151 -
 152
152 -
 153
153 -
 154
154 -
 155
155 -
156
-
157
-
158
-
159
-
160
-
161
-
162
-
163
-
164
-
165
-
166
-
167
-
168
-
169
-
170
-
171
-
172
-
173
-
174
-
175
-
176
-
177
-
178
-
179
-
180
 |
 |

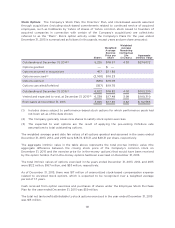
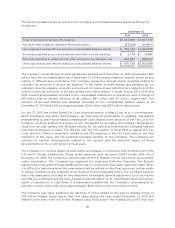
Stock Options. The Company’s Stock Plan, the Directors’ Plan, and stock-based awards assumed
through acquisitions (including stock-based commitments related to continued service of acquired
employees, such as holdbacks by Yahoo of shares of Yahoo common stock issued to founders of
acquired companies in connection with certain of the Company’s acquisitions) are collectively
referred to as the “Plans”. Stock option activity under the Company’s Plans for the year ended
December 31, 2015 is summarized as follows (in thousands, except years and per share amounts):
Shares
Weighted
Average
Exercise
Price per
Share
Weighted
Average
Remaining
Contractual
Life
(in years)
Aggregate
Intrinsic Value
Outstanding at December 31, 2014(1)
9,225 $18.57 4.33 $274,072
Options granted
—$—
Options assumed in acquisitions
407 $11.89
Options exercised(2)
(2,168) $16.23
Options expired
(585) $19.09
Options cancelled/forfeited
(357) $19.75
Outstanding at December 31, 2015(1)
6,522 $18.82 4.03 $103,230
Vested and expected to vest, at December 31, 2015(3)
6,338 $17.48 3.98 $100,310
Exercisable at December 31, 2015
3,925 $17.40 3.42 $ 62,553
(1) Includes shares subject to performance-based stock options for which performance goals had
not been set as of the date shown.
(2) The Company generally issues new shares to satisfy stock option exercises.
(3) The expected to vest options are the result of applying the pre-vesting forfeiture rate
assumptions to total outstanding options.
The weighted average grant date fair values of all options granted and assumed in the years ended
December 31, 2013, 2014, and 2015 were $18.72, $31.31, and $20.31 per share, respectively.
The aggregate intrinsic value in the table above represents the total pre-tax intrinsic value (the
aggregate difference between the closing stock price of the Company’s common stock on
December 31, 2015 and the exercise price for in-the-money options) that would have been received
by the option holders if all in-the-money options had been exercised on December 31, 2015.
The total intrinsic values of options exercised in the years ended December 31, 2013, 2014, and 2015
were $122 million, $167 million, and $53 million, respectively.
As of December 31, 2015, there was $17 million of unamortized stock-based compensation expense
related to unvested stock options, which is expected to be recognized over a weighted average
period of 1.7 years.
Cash received from option exercises and purchases of shares under the Employee Stock Purchase
Plan for the year ended December 31, 2015 was $59 million.
The total net tax benefit attributable to stock options exercised in the year ended December 31, 2015
was $15 million.
141