Yahoo 2015 Annual Report Download - page 71
Download and view the complete annual report
Please find page 71 of the 2015 Yahoo annual report below. You can navigate through the pages in the report by either clicking on the pages listed below, or by using the keyword search tool below to find specific information within the annual report.-
 1
1 -
2
-
3
-
4
-
5
-
6
-
7
-
8
-
9
-
10
-
11
-
12
-
13
-
14
-
15
-
16
-
17
-
18
-
19
-
20
-
21
-
22
-
23
-
24
-
25
-
26
-
27
-
28
-
29
-
30
-
31
-
32
-
33
-
34
-
35
-
36
-
37
-
38
-
39
-
40
-
41
-
42
-
43
-
44
-
45
-
46
-
47
-
48
-
49
-
50
-
51
-
52
-
53
-
54
-
55
-
56
-
57
-
58
-
59
-
60
-
 61
61 -
 62
62 -
 63
63 -
 64
64 -
 65
65 -
 66
66 -
 67
67 -
 68
68 -
 69
69 -
 70
70 -
 71
71 -
 72
72 -
 73
73 -
 74
74 -
 75
75 -
 76
76 -
 77
77 -
 78
78 -
 79
79 -
 80
80 -
 81
81 -
82
-
83
-
84
-
85
-
86
-
87
-
88
-
89
-
90
-
91
-
92
-
93
-
94
-
95
-
96
-
97
-
98
-
99
-
100
-
101
-
102
-
103
-
104
-
105
-
106
-
107
-
108
-
109
-
110
-
111
-
112
-
113
-
114
-
115
-
116
-
117
-
118
-
119
-
120
-
121
-
122
-
123
-
124
-
125
-
126
-
127
-
128
-
129
-
130
-
131
-
132
-
133
-
134
-
135
-
136
-
137
-
138
-
139
-
140
-
141
-
142
-
143
-
144
-
145
-
146
-
147
-
148
-
149
-
150
-
151
-
152
-
153
-
154
-
155
-
156
-
157
-
158
-
159
-
160
-
161
-
162
-
163
-
164
-
165
-
166
-
167
-
168
-
169
-
170
-
171
-
172
-
173
-
174
-
175
-
176
-
177
-
178
-
179
-
180
 |
 |
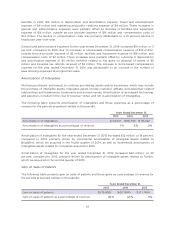
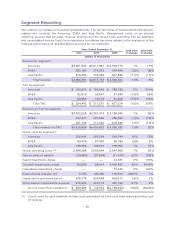
above. TAC in the Americas segment increased $622 million for the year ended December 31,
2015 due to increased payments to distribution partners, including Mozilla, TAC associated with
Gemini, and incremental TAC from the BrightRoll acquisition.
Americas revenue ex-TAC for the year ended December 31, 2014 increased $29 million, or 1 percent,
compared to 2013, due to an increase in revenue, as discussed above, partially offset by an increase
in TAC. TAC in the Americas segment increased $8 million for the year ended December 31, 2014 due
to increased search and listing-based TAC.
Revenue ex-TAC in the Americas accounted for approximately 78 percent of total revenue ex-TAC
for 2015, compared to 76 percent in 2014 and 75 percent in 2013.
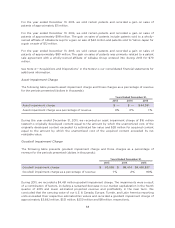
EMEA
EMEA revenue for the year ended December 31, 2015 decreased $31 million, or 8 percent, compared
to 2014, primarily due to unfavorable foreign exchange fluctuations of $44 million for the year ended
December 31, 2015, using the foreign currency exchange rates from the year ended December 31,
2014. Excluding the impact of foreign exchange, display and search revenue in the EMEA segment
increased $21 million and $3 million, respectively, and other revenue declined $11 million. The increase
in display revenue in the segment was attributable to an increase in Affiliate revenue in the region
primarily from native advertising.
EMEA revenue for the year ended December 31, 2014 decreased $10 million, or 3 percent, compared
to 2013, primarily due to an increase in search revenue of $30 million, which was offset by a decline in
display and other revenue of $23 million and $17 million, respectively. The increase in search revenue
for year ended December 31, 2014 was due to an increase in search advertising on Yahoo Properties
driven by distribution deals that contributed to improved revenue-per-search. The decline in display
revenue for the year ended December 31, 2014 was due to a decline in advertising revenue from
Affiliate sites and a decline in premium ads sold on Yahoo Properties, partially offset by an increase in
native advertising on Yahoo Properties, which launched in the region in 2014. The decline in other
revenue was primarily due to a decline in listings-based revenue.
Revenue in EMEA accounted for approximately 7 percent of total revenue for 2015, compared to 8
percent for both 2014 and 2013.
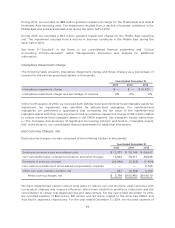
EMEA revenue ex-TAC for the year ended December 31, 2015 decreased $52 million, or 15 percent,
compared to 2014, primarily due to an increase in TAC and a decrease in revenue as discussed above.
The increase in TAC in the EMEA segment for the year ended December 31, 2015 was primarily driven
by an increase in display TAC of $17 million, associated with an increase in Affiliate TAC payments to
partners.
EMEA revenue ex-TAC for the year ended December 31, 2014 decreased $4 million, or 1 percent,
compared to 2013, primarily attributable to a decrease in revenue, as discussed above, partially offset
by a decrease in display TAC in the segment.
Revenue ex-TAC in EMEA accounted for approximately 7 percent of total revenue ex-TAC for 2015,
compared to 8 percent for both 2014 and 2013.
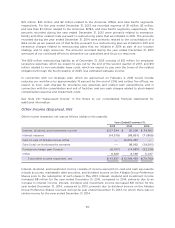
Asia Pacific
Asia Pacific revenue for the year ended December 31, 2015 decreased $78 million, or 11 percent,
compared to 2014, primarily due to unfavorable foreign exchange fluctuations of $52 million for the
year ended December 31, 2015, using the foreign currency exchange rates from the year ended
December 31, 2014. In addition to unfavorable foreign exchange fluctuations, the decline in Asia
67