Yahoo 2015 Annual Report Download - page 57
Download and view the complete annual report
Please find page 57 of the 2015 Yahoo annual report below. You can navigate through the pages in the report by either clicking on the pages listed below, or by using the keyword search tool below to find specific information within the annual report.-
 1
1 -
2
-
3
-
4
-
5
-
6
-
7
-
8
-
9
-
10
-
11
-
12
-
13
-
14
-
15
-
16
-
17
-
18
-
19
-
20
-
21
-
22
-
23
-
24
-
25
-
26
-
27
-
28
-
29
-
30
-
31
-
32
-
33
-
34
-
35
-
36
-
37
-
38
-
39
-
40
-
41
-
42
-
43
-
44
-
45
-
46
-
 47
47 -
 48
48 -
 49
49 -
 50
50 -
 51
51 -
 52
52 -
 53
53 -
 54
54 -
 55
55 -
 56
56 -
 57
57 -
 58
58 -
 59
59 -
 60
60 -
 61
61 -
 62
62 -
 63
63 -
 64
64 -
 65
65 -
 66
66 -
 67
67 -
68
-
69
-
70
-
71
-
72
-
73
-
74
-
75
-
76
-
77
-
78
-
79
-
80
-
81
-
82
-
83
-
84
-
85
-
86
-
87
-
88
-
89
-
90
-
91
-
92
-
93
-
94
-
95
-
96
-
97
-
98
-
99
-
100
-
101
-
102
-
103
-
104
-
105
-
106
-
107
-
108
-
109
-
110
-
111
-
112
-
113
-
114
-
115
-
116
-
117
-
118
-
119
-
120
-
121
-
122
-
123
-
124
-
125
-
126
-
127
-
128
-
129
-
130
-
131
-
132
-
133
-
134
-
135
-
136
-
137
-
138
-
139
-
140
-
141
-
142
-
143
-
144
-
145
-
146
-
147
-
148
-
149
-
150
-
151
-
152
-
153
-
154
-
155
-
156
-
157
-
158
-
159
-
160
-
161
-
162
-
163
-
164
-
165
-
166
-
167
-
168
-
169
-
170
-
171
-
172
-
173
-
174
-
175
-
176
-
177
-
178
-
179
-
180
 |
 |
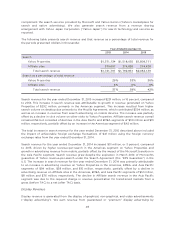
Improvements in the search metrics resulted in year-over-year growth of 9 percent in search click-
driven revenue for the year ended December 31, 2015.
For the year ended December 31, 2014, Paid Clicks increased 5 percent and Price-per-Click increased
11 percent, compared to 2013. The increase in Paid Clicks for the year ended December 31, 2014 was
attributable to an increase in Paid Clicks on Yahoo Properties from distribution partners primarily in
the Americas segment, partially offset by a decline in Paid Clicks on Affiliate sites related to traffic
quality initiatives across the segments. The increase in Price-per-Click for the year ended
December 31, 2014 was primarily driven by a higher mix of traffic from the Americas segment, which
is higher monetizing as compared to other segments, and improved Affiliate traffic quality across all
segments resulting in higher Price-per-Click. Improvements in Price-per-Click resulted in year-over-
year growth in search click-driven revenue for the year ended December 31, 2014 of 17 percent.
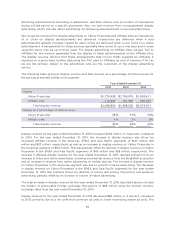
Display Metrics
For the year ended December 31, 2015, number of Ads Sold increased 12 percent and Price-per-Ad
increased 2 percent, compared to 2014. The increase in Ads Sold year-over-year for the year ended
December 31, 2015 was attributable to an increase in native and video ad units sold which was
partially offset by a decline in premium ad units sold. The increase in native ad units sold was
primarily attributable to growth internationally and growth in our network of mobile apps. Native ad
units represented approximately 44 percent of total Ads Sold for the year ended December 31, 2015,
as compared to 31 percent of total Ads Sold for the year ended December 31, 2014. The increase in
Price-per-Ad was due to improved pricing for native advertising and video representing a larger
share of the inventory mix, partially offset by a shift in the mix of Ads Sold from premium advertising
to native advertising.
For the year ended December 31, 2014, number of Ads Sold increased 6 percent and Price-per-Ad
decreased 9 percent, compared to 2013. The increase in number of Ads Sold for the year ended
December 31, 2014 was attributable to an increase in native ad units sold, partially offset by a decline
in audience Ads Sold. Native ad units were launched late in the second quarter of 2013. Native ad
units represented approximately 31 percent of total Ads Sold for the year ended December 31, 2014,
as compared to 5 percent of total Ads Sold for the year ended December 31, 2013. The decrease in
Price-per-Ad for the year ended December 31, 2014 was due to a shift in the mix of Ads Sold toward
lower monetizing native ad units.
Operating Costs and Expenses
Cost of Revenue—TAC
Cost of revenue—TAC consists of payments made to third-party entities that have integrated our
advertising offerings into their websites or other offerings and payments made to companies that
direct consumer and business traffic to Yahoo Properties. We enter into agreements of varying
duration that involve TAC. There are generally two economic structures of the Affiliate agreements:
fixed payments with or without a guaranteed minimum amount of traffic delivered or variable
payments based on a percentage of our revenue or based on a certain metric, such as number of
searches or paid clicks. We expense TAC under two different methods. Agreements with fixed
payments are expensed ratably over the term the fixed payment covers or as traffic is delivered.
Agreements based on a percentage of revenue, number of searches, or other metrics are expensed
based on the volume of the underlying activity or revenue multiplied by the agreed-upon price or
rate. We also have an agreement to compensate Mozilla for making us the default search provider on
certain of Mozilla’s products in the United States. We record those payments as cost of revenue—
TAC.
53