Yahoo 2015 Annual Report Download - page 93
Download and view the complete annual report
Please find page 93 of the 2015 Yahoo annual report below. You can navigate through the pages in the report by either clicking on the pages listed below, or by using the keyword search tool below to find specific information within the annual report.-
 1
1 -
2
-
3
-
4
-
5
-
6
-
7
-
8
-
9
-
10
-
11
-
12
-
13
-
14
-
15
-
16
-
17
-
18
-
19
-
20
-
21
-
22
-
23
-
24
-
25
-
26
-
27
-
28
-
29
-
30
-
31
-
32
-
33
-
34
-
35
-
36
-
37
-
38
-
39
-
40
-
41
-
42
-
43
-
44
-
45
-
46
-
47
-
48
-
49
-
50
-
51
-
52
-
53
-
54
-
55
-
56
-
57
-
58
-
59
-
60
-
61
-
62
-
63
-
64
-
65
-
66
-
67
-
68
-
69
-
70
-
71
-
72
-
73
-
74
-
75
-
76
-
77
-
78
-
79
-
80
-
81
-
82
-
 83
83 -
 84
84 -
 85
85 -
 86
86 -
 87
87 -
 88
88 -
 89
89 -
 90
90 -
 91
91 -
 92
92 -
 93
93 -
 94
94 -
 95
95 -
 96
96 -
 97
97 -
 98
98 -
 99
99 -
 100
100 -
 101
101 -
 102
102 -
 103
103 -
104
-
105
-
106
-
107
-
108
-
109
-
110
-
111
-
112
-
113
-
114
-
115
-
116
-
117
-
118
-
119
-
120
-
121
-
122
-
123
-
124
-
125
-
126
-
127
-
128
-
129
-
130
-
131
-
132
-
133
-
134
-
135
-
136
-
137
-
138
-
139
-
140
-
141
-
142
-
143
-
144
-
145
-
146
-
147
-
148
-
149
-
150
-
151
-
152
-
153
-
154
-
155
-
156
-
157
-
158
-
159
-
160
-
161
-
162
-
163
-
164
-
165
-
166
-
167
-
168
-
169
-
170
-
171
-
172
-
173
-
174
-
175
-
176
-
177
-
178
-
179
-
180
 |
 |

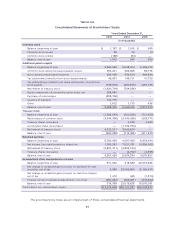
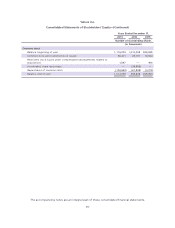
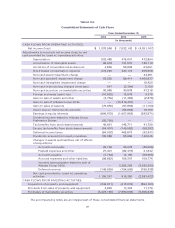
Yahoo! Inc.
Consolidated Statements of Stockholders’ Equity
Years Ended December 31,
2013 2014 2015
(in thousands)
Common stock
Balance, beginning of year
$ 1,187 $ 1,015 $ 945
Common stock issued
26 24 14
Common stock retired
(198) (94) —
Balance, end of year
1,015 945 959
Additional paid-in capital
Balance, beginning of year
9,563,348 8,688,304 8,499,475
Common stock and stock-based awards issued
353,241 306,608 58,778
Stock-based compensation expense
294,408 432,614 464,586
Tax (detriments) benefits from stock-based awards
49,061 145,711 41,729
Tax withholdings related to net share settlements of restricted
stock awards
(139,815) (280,879) (257,731)
Retirement of treasury stock
(1,620,704) (794,596) —
Equity component of convertible senior notes, net
268,084 — —
Purchase of note hedges
(205,706) — —
Issuance of warrants
124,775 — —
Other
1,612 1,713 436
Balance, end of year
8,688,304 8,499,475 8,807,273
Treasury stock
Balance, beginning of year
(1,368,043) (200,228) (712,455)
Repurchases of common stock
(3,344,396) (2,430,436) (203,771)
Treasury shares reissuance
— 4,189 4,693
Accelerated share repurchases
— (1,732,794) —
Retirement of treasury stock
4,512,211 3,646,814 —
Balance, end of year
(200,228) (712,455) (911,533)
Retained earnings
Balance, beginning of year
5,792,459 4,267,429 8,934,244
Net income (loss) attributable to Yahoo! Inc.
1,366,281 7,521,731 (4,359,082)
Retirement of treasury stock
(2,891,311) (2,852,124) —
Treasury shares reissuance
— (2,792) (4,355)
Balance, end of year
4,267,429 8,934,244 4,570,807
Accumulated other comprehensive income
Balance, beginning of year
571,249 318,389 22,019,628
Net change in unrealized gains (losses) on available-for-sale
securities, net of tax
5,980 22,069,855 (5,166,421)
Net change in unrealized gains (losses) on cash flow hedges,
net of tax
1,412 445 (1,374)
Foreign currency translation adjustments, net of tax
(260,252) (369,061) (275,802)
Balance, end of year
318,389 22,019,628 16,576,031
Total Yahoo! Inc. stockholders’ equity
$13,074,909 $38,741,837 $29,043,537
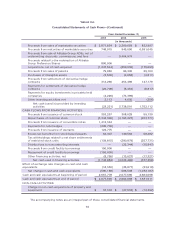
The accompanying notes are an integral part of these consolidated financial statements.
89