Yahoo 2015 Annual Report Download - page 129
Download and view the complete annual report
Please find page 129 of the 2015 Yahoo annual report below. You can navigate through the pages in the report by either clicking on the pages listed below, or by using the keyword search tool below to find specific information within the annual report.-
 1
1 -
2
-
3
-
4
-
5
-
6
-
7
-
8
-
9
-
10
-
11
-
12
-
13
-
14
-
15
-
16
-
17
-
18
-
19
-
20
-
21
-
22
-
23
-
24
-
25
-
26
-
27
-
28
-
29
-
30
-
31
-
32
-
33
-
34
-
35
-
36
-
37
-
38
-
39
-
40
-
41
-
42
-
43
-
44
-
45
-
46
-
47
-
48
-
49
-
50
-
51
-
52
-
53
-
54
-
55
-
56
-
57
-
58
-
59
-
60
-
61
-
62
-
63
-
64
-
65
-
66
-
67
-
68
-
69
-
70
-
71
-
72
-
73
-
74
-
75
-
76
-
77
-
78
-
79
-
80
-
81
-
82
-
83
-
84
-
85
-
86
-
87
-
88
-
89
-
90
-
91
-
92
-
93
-
94
-
95
-
96
-
97
-
98
-
99
-
100
-
101
-
102
-
103
-
104
-
105
-
106
-
107
-
108
-
109
-
110
-
111
-
112
-
113
-
114
-
115
-
116
-
117
-
118
-
 119
119 -
 120
120 -
 121
121 -
 122
122 -
 123
123 -
 124
124 -
 125
125 -
 126
126 -
 127
127 -
 128
128 -
 129
129 -
 130
130 -
 131
131 -
 132
132 -
 133
133 -
 134
134 -
 135
135 -
 136
136 -
 137
137 -
 138
138 -
 139
139 -
140
-
141
-
142
-
143
-
144
-
145
-
146
-
147
-
148
-
149
-
150
-
151
-
152
-
153
-
154
-
155
-
156
-
157
-
158
-
159
-
160
-
161
-
162
-
163
-
164
-
165
-
166
-
167
-
168
-
169
-
170
-
171
-
172
-
173
-
174
-
175
-
176
-
177
-
178
-
179
-
180
 |
 |

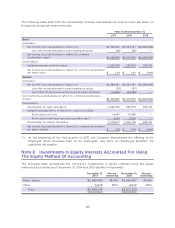
The following table sets forth the computation of basic and diluted net income (loss) per share (in
thousands, except per share amounts):
Years Ended December 31,
2013 2014 2015
Basic:
Numerator:
Net income (loss) attributable to Yahoo! Inc.
$1,366,281 $7,521,731 $(4,359,082)
Less: Net income allocated to participating securities
(28) (68) —
Net income (loss) attributable to Yahoo! Inc. common
stockholders—basic
$1,366,253 $7,521,663 $(4,359,082)
Denominator:
Weighted average common shares
1,052,705 987,819 939,141
Net income (loss) attributable to Yahoo! Inc. common stockholders
per share—basic
$ 1.30 $ 7.61 $ (4.64)
Diluted:
Numerator:
Net income (loss) attributable to Yahoo! Inc.
$1,366,281 $7,521,731 $(4,359,082)
Less: Net income allocated to participating securities
(28) (67) —
Less: Effect of dilutive securities issued by equity investees
(16,656) (43,689) —
Net income (loss) attributable to Yahoo! Inc. common stockholders—
diluted
$1,349,597 $7,477,975 $(4,359,082)
Denominator:
Denominator for basic calculation
1,052,705 987,819 939,141
Weighted average effect of Yahoo! Inc. dilutive securities:
Restricted stock units
14,097 12,365 —
Stock options and employee stock purchase plan(*)
4,009 3,924 —
Denominator for diluted calculation
1,070,811 1,004,108 939,141
Net income (loss) attributable to Yahoo! Inc. common stockholders
per share—diluted
$ 1.26 $ 7.45 $ (4.64)
(*) At the beginning of the first quarter of 2015, the Company discontinued the offering of the
Employee Stock Purchase Plan to its employees. See Note 14—“Employee Benefits” for
additional information.
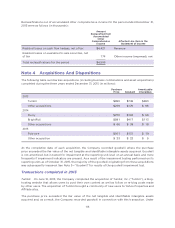
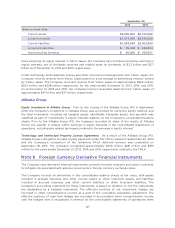
Note 8 Investments In Equity Interests Accounted For Using
The Equity Method Of Accounting
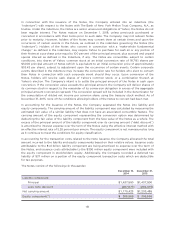
The following table summarizes the Company’s investments in equity interests using the equity
method of accounting as of December 31, 2014 and 2015 (dollars in thousands):
December 31,
2014
Percent
Ownership
December 31,
2015
Percent
Ownership
Yahoo Japan
$2,482,660 35.5% $2,496,657 35.5%
Other
6,918 20% 6,572 20%
Total
$2,489,578 $2,503,229
125