Yahoo 2015 Annual Report Download - page 70
Download and view the complete annual report
Please find page 70 of the 2015 Yahoo annual report below. You can navigate through the pages in the report by either clicking on the pages listed below, or by using the keyword search tool below to find specific information within the annual report.-
 1
1 -
2
-
3
-
4
-
5
-
6
-
7
-
8
-
9
-
10
-
11
-
12
-
13
-
14
-
15
-
16
-
17
-
18
-
19
-
20
-
21
-
22
-
23
-
24
-
25
-
26
-
27
-
28
-
29
-
30
-
31
-
32
-
33
-
34
-
35
-
36
-
37
-
38
-
39
-
40
-
41
-
42
-
43
-
44
-
45
-
46
-
47
-
48
-
49
-
50
-
51
-
52
-
53
-
54
-
55
-
56
-
57
-
58
-
59
-
 60
60 -
 61
61 -
 62
62 -
 63
63 -
 64
64 -
 65
65 -
 66
66 -
 67
67 -
 68
68 -
 69
69 -
 70
70 -
 71
71 -
 72
72 -
 73
73 -
 74
74 -
 75
75 -
 76
76 -
 77
77 -
 78
78 -
 79
79 -
 80
80 -
81
-
82
-
83
-
84
-
85
-
86
-
87
-
88
-
89
-
90
-
91
-
92
-
93
-
94
-
95
-
96
-
97
-
98
-
99
-
100
-
101
-
102
-
103
-
104
-
105
-
106
-
107
-
108
-
109
-
110
-
111
-
112
-
113
-
114
-
115
-
116
-
117
-
118
-
119
-
120
-
121
-
122
-
123
-
124
-
125
-
126
-
127
-
128
-
129
-
130
-
131
-
132
-
133
-
134
-
135
-
136
-
137
-
138
-
139
-
140
-
141
-
142
-
143
-
144
-
145
-
146
-
147
-
148
-
149
-
150
-
151
-
152
-
153
-
154
-
155
-
156
-
157
-
158
-
159
-
160
-
161
-
162
-
163
-
164
-
165
-
166
-
167
-
168
-
169
-
170
-
171
-
172
-
173
-
174
-
175
-
176
-
177
-
178
-
179
-
180
 |
 |
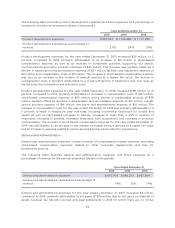
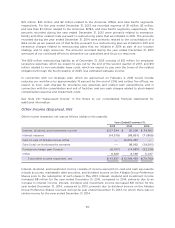
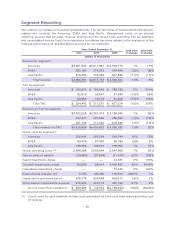
(2) Global operating costs include product development, marketing, real estate workplace, general
and administrative, and other corporate expenses that are managed on a global basis and that
are not directly attributable to any particular segment.
(3) The net cost reimbursements from Microsoft pursuant to the Search Agreement are primarily
included in global operating costs. Operating costs and expenses consist of cost of revenue—
TAC; cost of revenue—other; sales and marketing, product development; general and
administrative; amortization of intangible assets; and restructuring charges, net. Cost of
revenue—other consists of bandwidth costs and other expenses associated with the production
and usage of Yahoo Properties, including content expense and amortization of acquired
intellectual property rights and developed technology.
Revenue and Revenue ex-TAC by Segment
Americas
Americas revenue for the year ended December 31, 2015 increased $459 million, or 13 percent,
compared to 2014. The increase in Americas revenue for the year ended December 31, 2015 was
primarily attributable to increases in search and display revenue of $333 million and $239 million,
respectively, partially offset by a decline in other revenue of $113 million. The increase in Americas
search revenue for the year ended December 31, 2015 was attributable to an increase in search
revenue from mobile devices as well as $390 million attributable to the Mozilla Agreement, partially
offset by a decline in click volume on other visits to Yahoo Properties and on Affiliate sites. The
increase in Americas display revenue for the year ended December 31, 2015 was primarily associated
with an increase in video and native advertising, including incremental revenue following the
BrightRoll acquisition and an increase in revenue from mobile devices driven by native advertising.
The increase in Americas display revenue for the year ended December 31, 2015 was despite
unfavorable foreign exchange fluctuations related to Canada and Brazil of approximately $17 million.
The decrease in Americas other revenue for the year ended December 31, 2015 was primarily
attributable to declines in fees and listings-based revenue of $44 million and $68 million, respectively,
due to a decline in Alibaba Group royalty revenue under the TIPLA, a decline in shopping traffic,
expiration of a partner agreement, and declines in Yahoo Small Business associated with a reduction
in its subscriber base.
Americas revenue for year ended December 31, 2014 increased $36 million, or 1 percent, compared to
2013. The increase in Americas revenue for the year ended December 31, 2014 was primarily
attributable to an increase in search revenue of $82 million, partially offset by a decline in display and
other revenue of $36 million and $10 million, respectively. The increase in Americas search revenue
for the year ended December 31, 2014 was attributable to an increase in search revenue on Yahoo
Properties driven by higher revenue-per-search from a change in the design of the search results
page and an increase in search advertising from mobile devices. These increases were partially offset
by a decline in Affiliate search revenue and despite the expiration of the RPS Guarantee in the U.S. in
2014. The decrease in Americas display revenue for the year ended December 31, 2014 was primarily
due to a decline in premium ads sold on Yahoo Properties, partially offset by an increase in native
advertising. The decrease in Americas other revenue for the year ended December 31, 2014 was
primarily attributable to a decline in listings-based revenue, partially offset by an increase in fees
revenue, as a result of patent license revenue.
Revenue in the Americas accounted for approximately 80 percent of total revenue for 2015,
compared to 76 percent in 2014 and 74 percent in 2013.
Americas revenue ex-TAC for the year ended December 31, 2015 decreased $163 million, or 5 percent,
compared to 2014, due to an increase in TAC partially offset by an increase in revenue as discussed
66