Yahoo 2015 Annual Report Download - page 72
Download and view the complete annual report
Please find page 72 of the 2015 Yahoo annual report below. You can navigate through the pages in the report by either clicking on the pages listed below, or by using the keyword search tool below to find specific information within the annual report.-
 1
1 -
2
-
3
-
4
-
5
-
6
-
7
-
8
-
9
-
10
-
11
-
12
-
13
-
14
-
15
-
16
-
17
-
18
-
19
-
20
-
21
-
22
-
23
-
24
-
25
-
26
-
27
-
28
-
29
-
30
-
31
-
32
-
33
-
34
-
35
-
36
-
37
-
38
-
39
-
40
-
41
-
42
-
43
-
44
-
45
-
46
-
47
-
48
-
49
-
50
-
51
-
52
-
53
-
54
-
55
-
56
-
57
-
58
-
59
-
60
-
61
-
 62
62 -
 63
63 -
 64
64 -
 65
65 -
 66
66 -
 67
67 -
 68
68 -
 69
69 -
 70
70 -
 71
71 -
 72
72 -
 73
73 -
 74
74 -
 75
75 -
 76
76 -
 77
77 -
 78
78 -
 79
79 -
 80
80 -
 81
81 -
 82
82 -
83
-
84
-
85
-
86
-
87
-
88
-
89
-
90
-
91
-
92
-
93
-
94
-
95
-
96
-
97
-
98
-
99
-
100
-
101
-
102
-
103
-
104
-
105
-
106
-
107
-
108
-
109
-
110
-
111
-
112
-
113
-
114
-
115
-
116
-
117
-
118
-
119
-
120
-
121
-
122
-
123
-
124
-
125
-
126
-
127
-
128
-
129
-
130
-
131
-
132
-
133
-
134
-
135
-
136
-
137
-
138
-
139
-
140
-
141
-
142
-
143
-
144
-
145
-
146
-
147
-
148
-
149
-
150
-
151
-
152
-
153
-
154
-
155
-
156
-
157
-
158
-
159
-
160
-
161
-
162
-
163
-
164
-
165
-
166
-
167
-
168
-
169
-
170
-
171
-
172
-
173
-
174
-
175
-
176
-
177
-
178
-
179
-
180
 |
 |
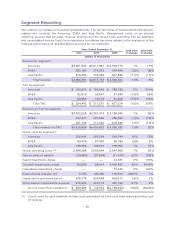
Pacific revenue for the year ended December 31, 2015 was driven primarily by a decrease in search
and other revenue of $7 million and $15 million, respectively.
Asia Pacific revenue for the year ended December 31, 2014 decreased $88 million, or 11 percent,
compared to 2013, primarily due to declines in search, display and other revenue of $61 million, $23
million, and $4 million, respectively. The decline in search revenue for the year ended December 31,
2014 was primarily attributable to the revenue share with Microsoft associated with the Search
Agreement. The decline in display revenue for the year ended December 31, 2014 was primarily
attributable to a decline in premium advertising on Yahoo Properties due to a decline in supply. This
decline was partially offset by an increase in non-guaranteed display advertising on Yahoo Properties
due to the launch of native advertising in the region.
Revenue in Asia Pacific accounted for approximately 13 percent of total revenue for 2015, compared
to 16 percent in 2014 and 17 percent in 2013.
Asia Pacific revenue ex-TAC for year ended December 31, 2015 decreased $95 million, or 13 percent,
compared to 2014, primarily due to an increase in TAC and a decrease in revenue as discussed above.
The increase in TAC in the Asia Pacific segment for the year ended December 31, 2015 was primarily
driven by an increase in display TAC of $17 million primarily associated with an increase in Affiliate
TAC payments to partners.
Asia Pacific revenue ex-TAC for the year ended December 31, 2014 decreased $50 million, or 7
percent, compared to 2013. The decline for the year ended December 31, 2014 was primarily
attributable to a decrease in revenue, as discussed above, partially offset by a decrease in TAC. The
decrease in TAC was driven by a decline in search TAC associated with a required change in revenue
presentation following the transition of paid search to Microsoft in the region, which is now
accounted for on a net (after TAC) basis. Revenue ex-TAC in the Asia Pacific segment was also
impacted by unfavorable foreign exchange fluctuations of $27 million for the year ended
December 31, 2014.
Revenue ex-TAC in Asia Pacific accounted for approximately 15 percent of total revenue ex-TAC for
2015, compared to 16 percent in 2014 and 17 percent in 2013.
Direct Costs by Segment
Americas
For the year ended December 31, 2015, direct costs attributable to the Americas segment increased
$36 million, or 13 percent, compared to 2014. The increase in direct costs was primarily due to higher
compensation costs from acquisitions of $33 million, marketing and public relations expense of $7
million, and other cost of revenue of $2 million, partially offset by lower content costs of $6 million.
For the year ended December 31, 2014, direct costs attributable to the Americas segment increased
$27 million, or 10 percent, compared to 2013. The increase in direct costs was primarily due to
increases in compensation costs of $14 million, marketing and public relations expense of $6 million
and content costs of $7 million.
Direct costs attributable to the Americas segment represented approximately 10 percent of Americas
revenue ex-TAC for 2015, compared to 8 percent for both 2014 and 2013.
EMEA
For the year ended December 31, 2015, direct costs attributable to the EMEA segment increased $8
million, or 9 percent, compared to 2014, respectively, primarily due to an increase in bad debt
expense of $15 million, partially offset by a decline in compensation costs of $6 million.
68