Yahoo 2015 Annual Report Download - page 43
Download and view the complete annual report
Please find page 43 of the 2015 Yahoo annual report below. You can navigate through the pages in the report by either clicking on the pages listed below, or by using the keyword search tool below to find specific information within the annual report.-
 1
1 -
2
-
3
-
4
-
5
-
6
-
7
-
8
-
9
-
10
-
11
-
12
-
13
-
14
-
15
-
16
-
17
-
18
-
19
-
20
-
21
-
22
-
23
-
24
-
25
-
26
-
27
-
28
-
29
-
30
-
31
-
32
-
 33
33 -
 34
34 -
 35
35 -
 36
36 -
 37
37 -
 38
38 -
 39
39 -
 40
40 -
 41
41 -
 42
42 -
 43
43 -
 44
44 -
 45
45 -
 46
46 -
 47
47 -
 48
48 -
 49
49 -
 50
50 -
 51
51 -
 52
52 -
 53
53 -
54
-
55
-
56
-
57
-
58
-
59
-
60
-
61
-
62
-
63
-
64
-
65
-
66
-
67
-
68
-
69
-
70
-
71
-
72
-
73
-
74
-
75
-
76
-
77
-
78
-
79
-
80
-
81
-
82
-
83
-
84
-
85
-
86
-
87
-
88
-
89
-
90
-
91
-
92
-
93
-
94
-
95
-
96
-
97
-
98
-
99
-
100
-
101
-
102
-
103
-
104
-
105
-
106
-
107
-
108
-
109
-
110
-
111
-
112
-
113
-
114
-
115
-
116
-
117
-
118
-
119
-
120
-
121
-
122
-
123
-
124
-
125
-
126
-
127
-
128
-
129
-
130
-
131
-
132
-
133
-
134
-
135
-
136
-
137
-
138
-
139
-
140
-
141
-
142
-
143
-
144
-
145
-
146
-
147
-
148
-
149
-
150
-
151
-
152
-
153
-
154
-
155
-
156
-
157
-
158
-
159
-
160
-
161
-
162
-
163
-
164
-
165
-
166
-
167
-
168
-
169
-
170
-
171
-
172
-
173
-
174
-
175
-
176
-
177
-
178
-
179
-
180
 |
 |
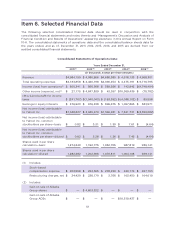
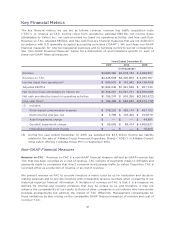
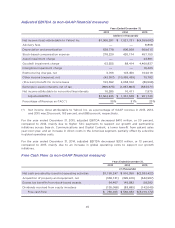
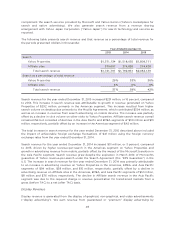
Consolidated Balance Sheets Data:
December 31,
2011 2012(1) 2013(2) 2014(3) 2015(4)
(In thousands)
Cash and cash equivalents
$ 1,562,390 $ 2,667,778 $ 2,077,590 $ 2,664,098 $ 1,631,911
Marketable securities
$ 967,527 $ 3,354,600 $ 2,919,804 $ 7,558,304 $ 5,201,073
Alibaba Group equity
securities
$ — $ — $ — $39,867,789 $31,172,361
Alibaba Group Preference
Shares
$ — $ 816,261 $ — $ — $ —
Working capital
$ 2,245,175 $ 4,362,481 $ 3,685,545 $ 4,929,438 $ 6,229,939
Goodwill
$ 3,900,752 $ 3,826,749 $ 4,679,648 $ 5,152,570 $ 808,114
Investments in equity
interests
$ 4,749,044 $ 2,840,157 $ 3,426,347 $ 2,489,578 $ 2,503,229
Total assets
$14,782,786 $17,103,253 $16,804,959 $61,707,336 $45,203,966
Income taxes payable
related to the sale of
Alibaba Group ADSs
$ — $ — $ — $ 3,282,293 $ —
Long-term deferred tax
liabilities related to
Alibaba Group equity
securities
$ — $ — $ — $16,154,906 $12,611,867
Long-term liabilities
$ 994,078 $ 1,207,418 $ 2,334,050 $ 2,251,855 $ 2,235,299
Total Yahoo! Inc.
stockholders’ equity
$12,541,067 $14,560,200 $13,074,909 $38,785,592 $29,079,420
(1) During the year ended December 31, 2012, we received $13.54 per Share, or approximately $7.1
billion in total consideration, for the 523 million Alibaba Group shares we sold back to Alibaba
Group. Approximately $6.3 billion of the consideration was received in cash and $800 million
was received in Alibaba Group Preference Shares. We paid cash taxes of $2.3 billion related to
the transaction.
(2) During the year ended December 31, 2013, we received net proceeds of $1.4 billion from the
issuance of the $1.4375 billion of 0.00% Convertible Notes due 2018 (the “Notes”) issued in
November 2013. See Note 11—“Convertible Notes” in the Notes to our consolidated financial
statements for additional information.
(3) During the year ended December 31, 2014, we received net proceeds of $9.4 billion from the
sale of Alibaba Group ADSs in Alibaba Group’s IPO. As a result of the IPO, we no longer account
for Alibaba Group using the equity method of accounting, and reflect our remaining investment
as an equity security rather than in investments in equity interests.
(4) During the year ended December 31, 2015, we satisfied the $3.3 billion income tax liability
related to the sale of ADSs in Alibaba Group’s IPO in September 2014.
39