Yahoo 2015 Annual Report Download - page 112
Download and view the complete annual report
Please find page 112 of the 2015 Yahoo annual report below. You can navigate through the pages in the report by either clicking on the pages listed below, or by using the keyword search tool below to find specific information within the annual report.-
 1
1 -
2
-
3
-
4
-
5
-
6
-
7
-
8
-
9
-
10
-
11
-
12
-
13
-
14
-
15
-
16
-
17
-
18
-
19
-
20
-
21
-
22
-
23
-
24
-
25
-
26
-
27
-
28
-
29
-
30
-
31
-
32
-
33
-
34
-
35
-
36
-
37
-
38
-
39
-
40
-
41
-
42
-
43
-
44
-
45
-
46
-
47
-
48
-
49
-
50
-
51
-
52
-
53
-
54
-
55
-
56
-
57
-
58
-
59
-
60
-
61
-
62
-
63
-
64
-
65
-
66
-
67
-
68
-
69
-
70
-
71
-
72
-
73
-
74
-
75
-
76
-
77
-
78
-
79
-
80
-
81
-
82
-
83
-
84
-
85
-
86
-
87
-
88
-
89
-
90
-
91
-
92
-
93
-
94
-
95
-
96
-
97
-
98
-
99
-
100
-
101
-
 102
102 -
 103
103 -
 104
104 -
 105
105 -
 106
106 -
 107
107 -
 108
108 -
 109
109 -
 110
110 -
 111
111 -
 112
112 -
 113
113 -
 114
114 -
 115
115 -
 116
116 -
 117
117 -
 118
118 -
 119
119 -
 120
120 -
 121
121 -
 122
122 -
123
-
124
-
125
-
126
-
127
-
128
-
129
-
130
-
131
-
132
-
133
-
134
-
135
-
136
-
137
-
138
-
139
-
140
-
141
-
142
-
143
-
144
-
145
-
146
-
147
-
148
-
149
-
150
-
151
-
152
-
153
-
154
-
155
-
156
-
157
-
158
-
159
-
160
-
161
-
162
-
163
-
164
-
165
-
166
-
167
-
168
-
169
-
170
-
171
-
172
-
173
-
174
-
175
-
176
-
177
-
178
-
179
-
180
 |
 |

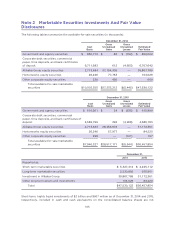
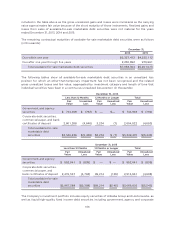
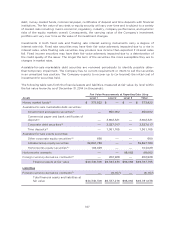
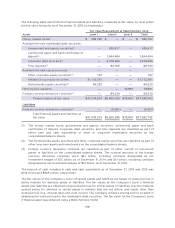
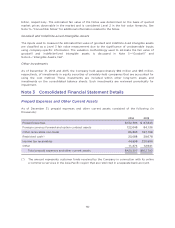
The following table sets forth the financial assets and liabilities, measured at fair value, by level within
the fair value hierarchy as of December 31, 2015 (in thousands):
Fair Value Measurements at Reporting Date Using
Assets Level 1 Level 2 Level 3 Total
Money market funds(1)
$ 386,792 $ — $ — $ 386,792
Available-for-sale marketable debt securities:
Government and agency securities(1)
— 635,917 — 635,917
Commercial paper and bank certificates of
deposit(1)
— 1,844,494 — 1,844,494
Corporate debt securities(1)
— 2,918,496 — 2,918,496
Time deposits(1)
— 82,703 — 82,703
Available-for-sale equity securities:
———
Other corporate equity securities(2)
197 — — 197
Alibaba Group equity securities
31,172,361 — — 31,172,361
Hortonworks equity securities(2)
84,223 — — 84,223
Hortonworks warrants
— — 78,861 78,861
Foreign currency derivative contracts(3)
— 84,319 — 84,319
Financial assets at fair value
$31,643,573 $5,565,929 $78,861 $37,288,363
Liabilities
Foreign currency derivative contracts(3)
— (5,661) — (5,661)
Total financial assets and liabilities at
fair value
$31,643,573 $5,560,268 $78,861 $37,282,702
(1) The money market funds, government and agency securities, commercial paper and bank
certificates of deposit, corporate debt securities, and time deposits are classified as part of
either cash and cash equivalents or short or long-term marketable securities on the
consolidated balance sheets.
(2) The Hortonworks equity securities and other corporate equity securities are classified as part of
other long-term assets and investments on the consolidated balance sheets.
(3) Foreign currency derivative contracts are classified as part of either current or noncurrent
assets or liabilities on the consolidated balance sheets. The notional amounts of the foreign
currency derivative contracts were: $2.1 billion, including contracts designated as net
investment hedges of $1.6 billion, as of December 31, 2014; and $1.5 billion, including contracts
designated as net investment hedges of $1.2 billion, as of December 31, 2015.
The amount of cash included in cash and cash equivalents as of December 31, 2014 and 2015 was
$712 million and $965 million, respectively.
The fair values of the Company’s Level 1 financial assets and liabilities are based on quoted prices in
active markets for identical assets or liabilities. The fair values of the Company’s Level 2 financial
assets and liabilities are obtained using quoted prices for similar assets or liabilities in active markets;
quoted prices for identical or similar assets in markets that are not active; and inputs other than
quoted prices (e.g., interest rates and yield curves). The Company utilizes a pricing service to assist in
obtaining fair value pricing for the marketable debt securities. The fair value for the Company’s Level
3 financial asset was obtained using a Black-Scholes model.
108