Yahoo 2015 Annual Report Download - page 158
Download and view the complete annual report
Please find page 158 of the 2015 Yahoo annual report below. You can navigate through the pages in the report by either clicking on the pages listed below, or by using the keyword search tool below to find specific information within the annual report.-
 1
1 -
2
-
3
-
4
-
5
-
6
-
7
-
8
-
9
-
10
-
11
-
12
-
13
-
14
-
15
-
16
-
17
-
18
-
19
-
20
-
21
-
22
-
23
-
24
-
25
-
26
-
27
-
28
-
29
-
30
-
31
-
32
-
33
-
34
-
35
-
36
-
37
-
38
-
39
-
40
-
41
-
42
-
43
-
44
-
45
-
46
-
47
-
48
-
49
-
50
-
51
-
52
-
53
-
54
-
55
-
56
-
57
-
58
-
59
-
60
-
61
-
62
-
63
-
64
-
65
-
66
-
67
-
68
-
69
-
70
-
71
-
72
-
73
-
74
-
75
-
76
-
77
-
78
-
79
-
80
-
81
-
82
-
83
-
84
-
85
-
86
-
87
-
88
-
89
-
90
-
91
-
92
-
93
-
94
-
95
-
96
-
97
-
98
-
99
-
100
-
101
-
102
-
103
-
104
-
105
-
106
-
107
-
108
-
109
-
110
-
111
-
112
-
113
-
114
-
115
-
116
-
117
-
118
-
119
-
120
-
121
-
122
-
123
-
124
-
125
-
126
-
127
-
128
-
129
-
130
-
131
-
132
-
133
-
134
-
135
-
136
-
137
-
138
-
139
-
140
-
141
-
142
-
143
-
144
-
145
-
146
-
147
-
 148
148 -
 149
149 -
 150
150 -
 151
151 -
 152
152 -
 153
153 -
 154
154 -
 155
155 -
 156
156 -
 157
157 -
 158
158 -
 159
159 -
 160
160 -
 161
161 -
 162
162 -
 163
163 -
 164
164 -
 165
165 -
 166
166 -
 167
167 -
 168
168 -
169
-
170
-
171
-
172
-
173
-
174
-
175
-
176
-
177
-
178
-
179
-
180
 |
 |

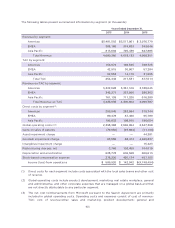
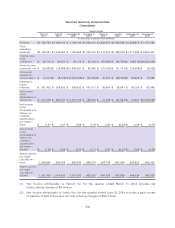
administrative; amortization of intangible assets; and restructuring charges, net. Cost of
revenue-other consists of bandwidth costs and other expenses associated with the production
and usage of Yahoo Properties, including content expense and amortization of acquired
intellectual property rights and developed technology.
Years Ended December 31,
2013 2014 2015
Capital expenditures, net:
Americas
$309,215 $357,512 $490,780
EMEA
11,435 20,034 25,479
Asia Pacific
17,481 18,069 26,728
Total capital expenditures, net
$338,131 $395,615 $542,987
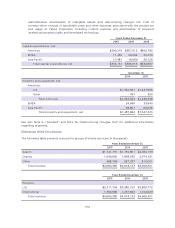
December 31,
2014 2015
Property and equipment, net:
Americas:
U.S.
$1,382,597 $1,447,995
Other
787 353
Total Americas
$1,383,384 $1,448,348
EMEA
34,649 33,940
Asia Pacific
69,651 65,035
Total property and equipment, net
$1,487,684 $1,547,323
See also Note 5—“Goodwill” and Note 15—“Restructuring Charges, Net” for additional information
regarding segments.
Enterprise Wide Disclosures:
The following table presents revenue for groups of similar services (in thousands):
Years Ended December 31,
2013 2014 2015
Search
$1,741,791 $1,792,861 $2,084,139
Display
1,949,830 1,868,035 2,074,161
Other
988,759 957,237 810,001
Total revenue
$4,680,380 $4,618,133 $4,968,301
Years Ended December 31,
2013 2014 2015
Revenue:
U.S.
$3,317,794 $3,380,310 $3,865,772
International
1,362,586 1,237,823 1,102,529
Total revenue
$4,680,380 $4,618,133 $4,968,301
154