Yahoo 2015 Annual Report Download - page 109
Download and view the complete annual report
Please find page 109 of the 2015 Yahoo annual report below. You can navigate through the pages in the report by either clicking on the pages listed below, or by using the keyword search tool below to find specific information within the annual report.-
 1
1 -
2
-
3
-
4
-
5
-
6
-
7
-
8
-
9
-
10
-
11
-
12
-
13
-
14
-
15
-
16
-
17
-
18
-
19
-
20
-
21
-
22
-
23
-
24
-
25
-
26
-
27
-
28
-
29
-
30
-
31
-
32
-
33
-
34
-
35
-
36
-
37
-
38
-
39
-
40
-
41
-
42
-
43
-
44
-
45
-
46
-
47
-
48
-
49
-
50
-
51
-
52
-
53
-
54
-
55
-
56
-
57
-
58
-
59
-
60
-
61
-
62
-
63
-
64
-
65
-
66
-
67
-
68
-
69
-
70
-
71
-
72
-
73
-
74
-
75
-
76
-
77
-
78
-
79
-
80
-
81
-
82
-
83
-
84
-
85
-
86
-
87
-
88
-
89
-
90
-
91
-
92
-
93
-
94
-
95
-
96
-
97
-
98
-
 99
99 -
 100
100 -
 101
101 -
 102
102 -
 103
103 -
 104
104 -
 105
105 -
 106
106 -
 107
107 -
 108
108 -
 109
109 -
 110
110 -
 111
111 -
 112
112 -
 113
113 -
 114
114 -
 115
115 -
 116
116 -
 117
117 -
 118
118 -
 119
119 -
120
-
121
-
122
-
123
-
124
-
125
-
126
-
127
-
128
-
129
-
130
-
131
-
132
-
133
-
134
-
135
-
136
-
137
-
138
-
139
-
140
-
141
-
142
-
143
-
144
-
145
-
146
-
147
-
148
-
149
-
150
-
151
-
152
-
153
-
154
-
155
-
156
-
157
-
158
-
159
-
160
-
161
-
162
-
163
-
164
-
165
-
166
-
167
-
168
-
169
-
170
-
171
-
172
-
173
-
174
-
175
-
176
-
177
-
178
-
179
-
180
 |
 |
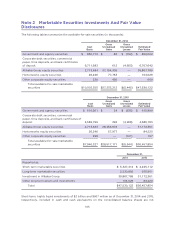
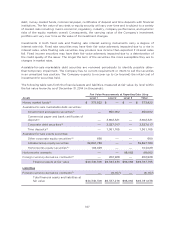
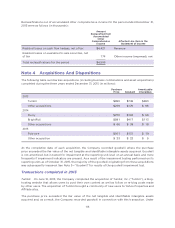
Note 2 Marketable Securities Investments And Fair Value
Disclosures
The following tables summarize the available-for-sale securities (in thousands):
December 31, 2014
Cost
Basis
Gross
Unrealized
Gains
Gross
Unrealized
Losses
Estimated
Fair Value
Government and agency securities
$ 850,712 $ 82 $ (792) $ 850,002
Corporate debt securities, commercial
paper, time deposits, and bank certificates
of deposit
6,711,683 612 (4,653) 6,707,642
Alibaba Group equity securities
2,713,484 37,154,305 — 39,867,789
Hortonworks equity securities
26,246 77,783 — 104,029
Other corporate equity securities
230 430 — 660
Total available-for-sale marketable
securities
$10,302,355 $37,233,212 $(5,445) $47,530,122
December 31, 2015
Cost
Basis
Gross
Unrealized
Gains
Gross
Unrealized
Losses
Estimated
Fair Value
Government and agency securities
$ 616,501 $ 24 $ (635) $ 615,890
Corporate debt securities, commercial
paper, time deposits, and bank certificates of
deposit
4,589,799 292 (4,908) 4,585,183
Alibaba Group equity securities
2,713,483 28,458,878 — 31,172,361
Hortonworks equity securities
26,246 57,977 — 84,223
Other corporate equity securities
298 — (101) 197
Total available-for-sale marketable
securities
$7,946,327 $28,517,171 $(5,644) $36,457,854
December 31,
2014 2015
Reported as:
Short-term marketable securities
$ 5,327,412 $ 4,225,112
Long-term marketable securities
2,230,892 975,961
Investment in Alibaba Group
39,867,789 31,172,361
Other long-term assets and investments
104,029 84,420
Total
$47,530,122 $36,457,854
Short-term, highly liquid investments of $2 billion and $667 million as of December 31, 2014 and 2015,
respectively, included in cash and cash equivalents on the consolidated balance sheets are not
105