Yahoo 2015 Annual Report Download - page 58
Download and view the complete annual report
Please find page 58 of the 2015 Yahoo annual report below. You can navigate through the pages in the report by either clicking on the pages listed below, or by using the keyword search tool below to find specific information within the annual report.-
 1
1 -
2
-
3
-
4
-
5
-
6
-
7
-
8
-
9
-
10
-
11
-
12
-
13
-
14
-
15
-
16
-
17
-
18
-
19
-
20
-
21
-
22
-
23
-
24
-
25
-
26
-
27
-
28
-
29
-
30
-
31
-
32
-
33
-
34
-
35
-
36
-
37
-
38
-
39
-
40
-
41
-
42
-
43
-
44
-
45
-
46
-
47
-
 48
48 -
 49
49 -
 50
50 -
 51
51 -
 52
52 -
 53
53 -
 54
54 -
 55
55 -
 56
56 -
 57
57 -
 58
58 -
 59
59 -
 60
60 -
 61
61 -
 62
62 -
 63
63 -
 64
64 -
 65
65 -
 66
66 -
 67
67 -
 68
68 -
69
-
70
-
71
-
72
-
73
-
74
-
75
-
76
-
77
-
78
-
79
-
80
-
81
-
82
-
83
-
84
-
85
-
86
-
87
-
88
-
89
-
90
-
91
-
92
-
93
-
94
-
95
-
96
-
97
-
98
-
99
-
100
-
101
-
102
-
103
-
104
-
105
-
106
-
107
-
108
-
109
-
110
-
111
-
112
-
113
-
114
-
115
-
116
-
117
-
118
-
119
-
120
-
121
-
122
-
123
-
124
-
125
-
126
-
127
-
128
-
129
-
130
-
131
-
132
-
133
-
134
-
135
-
136
-
137
-
138
-
139
-
140
-
141
-
142
-
143
-
144
-
145
-
146
-
147
-
148
-
149
-
150
-
151
-
152
-
153
-
154
-
155
-
156
-
157
-
158
-
159
-
160
-
161
-
162
-
163
-
164
-
165
-
166
-
167
-
168
-
169
-
170
-
171
-
172
-
173
-
174
-
175
-
176
-
177
-
178
-
179
-
180
 |
 |

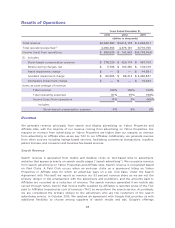
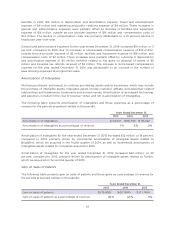
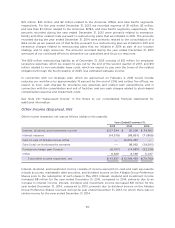
The following table presents cost of revenue—TAC and those expenses as a percentage of revenue
for the periods presented (dollars in thousands):
Years Ended December 31,
2013 2014 2015
Cost of revenue—TAC
$ 254,442 $ 217,531 $ 877,514
Cost of revenue—TAC as a percentage of revenue
6% 5% 18%
Cost of revenue—TAC for the year ended December 31, 2015 increased $660 million, or 303 percent,
compared to 2014, primarily due to increased payments to distribution partners (including Mozilla
which contributed $375 million) as well as increased TAC associated with Gemini, and incremental
TAC from the BrightRoll acquisition.
Cost of revenue—TAC for the year ended December 31, 2014 decreased $37 million, or 15 percent,
compared to 2013. The decrease for the year ended December 31, 2014, compared to 2013, was
primarily attributable to declines in TAC in the Asia Pacific and EMEA segments of $38 million and $6
million, respectively, partially offset by an increase in TAC in the Americas segment of $8 million
related to an increase in search and listings-based TAC. The decline in the Asia Pacific segment was
primarily attributable to the required change in revenue presentation for transitioned markets from a
gross (before TAC) basis to a net (after TAC).
We expect cost of revenue—TAC to continue to grow in 2016 as a result of an increase in traffic on
Affiliate sites through our Gemini platform across search and native advertising.
Cost of Revenue—Other
Cost of revenue—other consists of bandwidth costs, stock-based compensation, content and other
expenses associated with the production and usage of Yahoo Properties, including content expense
and amortization of developed technology and patents. Cost of revenue—other also includes costs
for Yahoo’s technology platforms and infrastructure, including depreciation expense and other
operating costs, directly related to revenue generating activities.
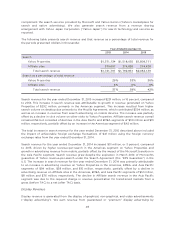
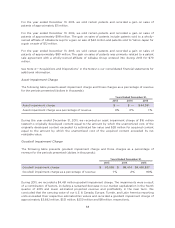
The following table presents cost of revenue—other and those expenses as a percentage of revenue
for the periods presented (dollars in thousands):
Years Ended December 31,
2013 2014 2015
Cost of revenue—other
$ 1,094,938 $ 1,169,844 $ 1,200,234
Cost of revenue—other as a percentage of revenue
23% 25% 24%
Cost of revenue—other increased $30 million, or 3 percent, for the year ended December 31, 2015,
compared to 2014, primarily due to higher cost of revenue of $48 million related to algorithmic
serving costs, our e-commerce business in the Asia Pacific segment, BrightRoll video advertising fees,
an increase in depreciation and amortization expense of $16 million, and an increase in content
expense of $13 million. This increase in cost of revenue—other was partially offset by declines in
bandwidth costs of $21 million, stock-based compensation expense of $10 million, and compensation
costs of $17 million.
54