Yahoo 2015 Annual Report Download - page 73
Download and view the complete annual report
Please find page 73 of the 2015 Yahoo annual report below. You can navigate through the pages in the report by either clicking on the pages listed below, or by using the keyword search tool below to find specific information within the annual report.-
 1
1 -
2
-
3
-
4
-
5
-
6
-
7
-
8
-
9
-
10
-
11
-
12
-
13
-
14
-
15
-
16
-
17
-
18
-
19
-
20
-
21
-
22
-
23
-
24
-
25
-
26
-
27
-
28
-
29
-
30
-
31
-
32
-
33
-
34
-
35
-
36
-
37
-
38
-
39
-
40
-
41
-
42
-
43
-
44
-
45
-
46
-
47
-
48
-
49
-
50
-
51
-
52
-
53
-
54
-
55
-
56
-
57
-
58
-
59
-
60
-
61
-
62
-
 63
63 -
 64
64 -
 65
65 -
 66
66 -
 67
67 -
 68
68 -
 69
69 -
 70
70 -
 71
71 -
 72
72 -
 73
73 -
 74
74 -
 75
75 -
 76
76 -
 77
77 -
 78
78 -
 79
79 -
 80
80 -
 81
81 -
 82
82 -
 83
83 -
84
-
85
-
86
-
87
-
88
-
89
-
90
-
91
-
92
-
93
-
94
-
95
-
96
-
97
-
98
-
99
-
100
-
101
-
102
-
103
-
104
-
105
-
106
-
107
-
108
-
109
-
110
-
111
-
112
-
113
-
114
-
115
-
116
-
117
-
118
-
119
-
120
-
121
-
122
-
123
-
124
-
125
-
126
-
127
-
128
-
129
-
130
-
131
-
132
-
133
-
134
-
135
-
136
-
137
-
138
-
139
-
140
-
141
-
142
-
143
-
144
-
145
-
146
-
147
-
148
-
149
-
150
-
151
-
152
-
153
-
154
-
155
-
156
-
157
-
158
-
159
-
160
-
161
-
162
-
163
-
164
-
165
-
166
-
167
-
168
-
169
-
170
-
171
-
172
-
173
-
174
-
175
-
176
-
177
-
178
-
179
-
180
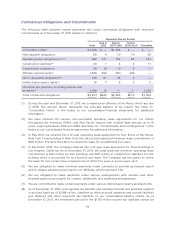
 |
 |
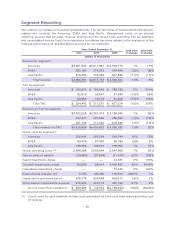
For the year ended December 31, 2014, direct costs attributable to the EMEA segment decreased $2
million, or 2 percent, compared to 2013, primarily due to a decline in compensation costs, and
bandwidth and other cost of revenue.
Direct costs attributable to the EMEA segment represented approximately 33 percent of EMEA
revenue ex-TAC for 2015, compared to 26 percent for both 2014 and 2013.
Asia Pacific
For the year ended December 31, 2015, direct costs attributable to the Asia Pacific segment
decreased $3 million, or 1 percent, compared to 2014, primarily due to a decline in compensation
costs of $16 million and outside service provider expenses of $2 million, partially offset by an increase
in other cost of revenue of $14 million related to our e-commerce business in the region.
For the year ended December 31, 2014, direct costs attributable to the Asia Pacific segment increased
$2 million, or 1 percent, compared to 2013. The increase was primarily attributable to increases in
bandwidth and other cost of revenue of $3 million, content costs of $3 million, and compensation
costs of $2 million, partially offset by a decline in outside service provider expenses of $5 million.
Direct costs attributable to the Asia Pacific segment represented approximately 32 percent of Asia
Pacific revenue ex-TAC for 2015, compared to 28 percent and 26 percent in 2014 and 2013,
respectively.
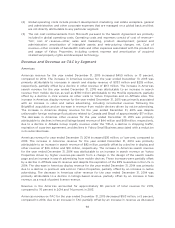
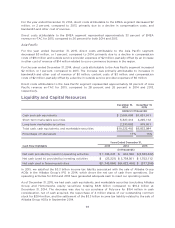
Liquidity and Capital Resources
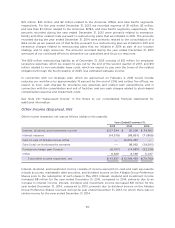
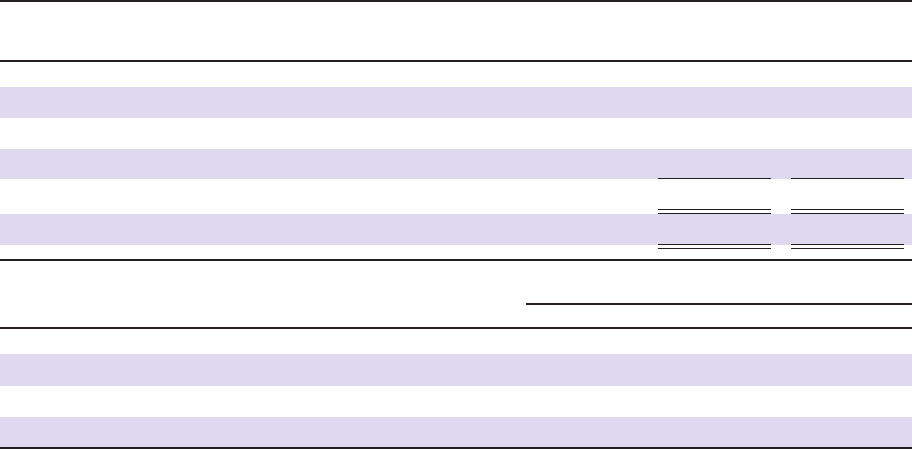
December 31,
2014
December 31,
2015
(dollars in thousands)
Cash and cash equivalents
$ 2,664,098 $1,631,911
Short-term marketable securities
5,327,412 4,225,112
Long-term marketable securities
2,230,892 975,961
Total cash, cash equivalents, and marketable securities
$10,222,402 $6,832,984
Percentage of total assets
17% 15%
Years Ended December 31,
Cash Flow Highlights 2013 2014 2015
(in thousands)
Net cash provided by (used in) operating activities
$ 1,195,247 $ 916,350 $(2,383,422)
Net cash (used in) provided by investing activities
$ (23,221) $ 3,738,501 $ 1,752,112
Net cash used in financing activities
$(1,743,884) $(4,022,466) $ (377,258)
In 2015, we satisfied the $3.3 billion income tax liability associated with the sale of Alibaba Group
ADSs in the Alibaba Group’s IPO in 2014, which drove the net use of cash from operations. Our
operating activities for 2014 and 2013 have generated adequate cash to meet our operating needs.
As of December 31, 2015, we had cash, cash equivalents, and marketable securities (excluding Alibaba
Group and Hortonworks equity securities) totaling $6.8 billion compared to $10.2 billion at
December 31, 2014. The decrease was due to our purchase of Polyvore for $154 million in cash
consideration, net of cash acquired, the repurchase of 4 million shares of our outstanding common
stock for $204 million, and the settlement of the $3.3 billion income tax liability related to the sale of
Alibaba Group ADSs in September 2014.
69