Yahoo 2015 Annual Report Download - page 110
Download and view the complete annual report
Please find page 110 of the 2015 Yahoo annual report below. You can navigate through the pages in the report by either clicking on the pages listed below, or by using the keyword search tool below to find specific information within the annual report.-
 1
1 -
2
-
3
-
4
-
5
-
6
-
7
-
8
-
9
-
10
-
11
-
12
-
13
-
14
-
15
-
16
-
17
-
18
-
19
-
20
-
21
-
22
-
23
-
24
-
25
-
26
-
27
-
28
-
29
-
30
-
31
-
32
-
33
-
34
-
35
-
36
-
37
-
38
-
39
-
40
-
41
-
42
-
43
-
44
-
45
-
46
-
47
-
48
-
49
-
50
-
51
-
52
-
53
-
54
-
55
-
56
-
57
-
58
-
59
-
60
-
61
-
62
-
63
-
64
-
65
-
66
-
67
-
68
-
69
-
70
-
71
-
72
-
73
-
74
-
75
-
76
-
77
-
78
-
79
-
80
-
81
-
82
-
83
-
84
-
85
-
86
-
87
-
88
-
89
-
90
-
91
-
92
-
93
-
94
-
95
-
96
-
97
-
98
-
99
-
 100
100 -
 101
101 -
 102
102 -
 103
103 -
 104
104 -
 105
105 -
 106
106 -
 107
107 -
 108
108 -
 109
109 -
 110
110 -
 111
111 -
 112
112 -
 113
113 -
 114
114 -
 115
115 -
 116
116 -
 117
117 -
 118
118 -
 119
119 -
 120
120 -
121
-
122
-
123
-
124
-
125
-
126
-
127
-
128
-
129
-
130
-
131
-
132
-
133
-
134
-
135
-
136
-
137
-
138
-
139
-
140
-
141
-
142
-
143
-
144
-
145
-
146
-
147
-
148
-
149
-
150
-
151
-
152
-
153
-
154
-
155
-
156
-
157
-
158
-
159
-
160
-
161
-
162
-
163
-
164
-
165
-
166
-
167
-
168
-
169
-
170
-
171
-
172
-
173
-
174
-
175
-
176
-
177
-
178
-
179
-
180
 |
 |

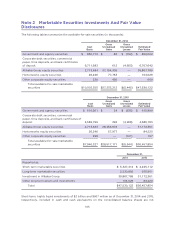
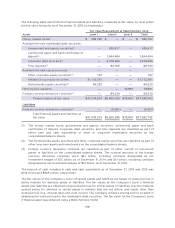
included in the table above as the gross unrealized gains and losses were immaterial as the carrying
value approximates fair value because of the short maturity of those instruments. Realized gains and
losses from sales of available-for-sale marketable debt securities were not material for the years
ended December 31, 2013, 2014 and 2015.
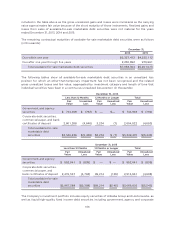
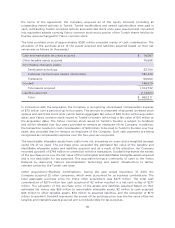
The remaining contractual maturities of available-for-sale marketable debt securities were as follows
(in thousands):
December 31,
2014 2015
Due within one year
$5,327,412 $4,225,112
Due after one year through five years
2,230,892 975,961
Total available-for-sale marketable debt securities
$7,558,304 $5,201,073
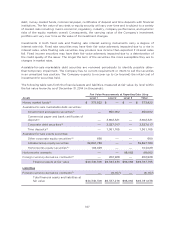
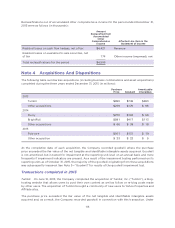
The following tables show all available-for-sale marketable debt securities in an unrealized loss
position for which an other-than-temporary impairment has not been recognized and the related
gross unrealized losses and fair value, aggregated by investment category and length of time that
individual securities have been in a continuous unrealized loss position (in thousands):
December 31, 2014
Less than 12 Months 12 Months or Longer Total
Fair
Value
Unrealized
Loss
Fair
Value
Unrealized
Loss
Fair
Value
Unrealized
Loss
Government and agency
securities
$ 744,948 $ (792) $ — $— $ 744,948 $ (792)
Corporate debt securities,
commercial paper, and bank
certificates of deposit
2,601,288 (4,646) 3,234 (7) 2,604,522 (4,653)
Total available-for-sale
marketable debt
securities
$3,346,236 $(5,438) $3,234 $ (7) $3,349,470 $(5,445)
December 31, 2015
Less than 12 Months 12 Months or Longer Total
Fair
Value
Unrealized
Loss
Fair
Value
Unrealized
Loss
Fair
Value
Unrealized
Loss
Government and agency
securities
$ 552,041 $ (635) $ — $ — $ 552,041 $ (635)
Corporate debt securities,
commercial paper, and
bank certificates of deposit
2,415,347 (4,763) 99,214 (145) 2,514,561 (4,908)
Total available-for-sale
marketable debt
securities
$2,967,388 $(5,398) $99,214 $(145) $3,066,602 $(5,543)
The Company’s investment portfolio includes equity securities of Alibaba Group and Hortonworks, as
well as liquid high-quality fixed income debt securities including government, agency and corporate
106