Yahoo 2015 Annual Report Download - page 63
Download and view the complete annual report
Please find page 63 of the 2015 Yahoo annual report below. You can navigate through the pages in the report by either clicking on the pages listed below, or by using the keyword search tool below to find specific information within the annual report.-
 1
1 -
2
-
3
-
4
-
5
-
6
-
7
-
8
-
9
-
10
-
11
-
12
-
13
-
14
-
15
-
16
-
17
-
18
-
19
-
20
-
21
-
22
-
23
-
24
-
25
-
26
-
27
-
28
-
29
-
30
-
31
-
32
-
33
-
34
-
35
-
36
-
37
-
38
-
39
-
40
-
41
-
42
-
43
-
44
-
45
-
46
-
47
-
48
-
49
-
50
-
51
-
52
-
 53
53 -
 54
54 -
 55
55 -
 56
56 -
 57
57 -
 58
58 -
 59
59 -
 60
60 -
 61
61 -
 62
62 -
 63
63 -
 64
64 -
 65
65 -
 66
66 -
 67
67 -
 68
68 -
 69
69 -
 70
70 -
 71
71 -
 72
72 -
 73
73 -
74
-
75
-
76
-
77
-
78
-
79
-
80
-
81
-
82
-
83
-
84
-
85
-
86
-
87
-
88
-
89
-
90
-
91
-
92
-
93
-
94
-
95
-
96
-
97
-
98
-
99
-
100
-
101
-
102
-
103
-
104
-
105
-
106
-
107
-
108
-
109
-
110
-
111
-
112
-
113
-
114
-
115
-
116
-
117
-
118
-
119
-
120
-
121
-
122
-
123
-
124
-
125
-
126
-
127
-
128
-
129
-
130
-
131
-
132
-
133
-
134
-
135
-
136
-
137
-
138
-
139
-
140
-
141
-
142
-
143
-
144
-
145
-
146
-
147
-
148
-
149
-
150
-
151
-
152
-
153
-
154
-
155
-
156
-
157
-
158
-
159
-
160
-
161
-
162
-
163
-
164
-
165
-
166
-
167
-
168
-
169
-
170
-
171
-
172
-
173
-
174
-
175
-
176
-
177
-
178
-
179
-
180
 |
 |
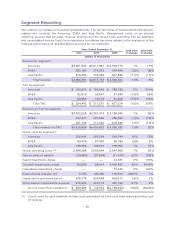
During 2014, we recorded an $88 million goodwill impairment charge for the Middle East and India &
Southeast Asia reporting units. The impairment resulted from a decline in business conditions in the
Middle East and India & Southeast Asia during the latter half of 2014.
During 2013, we recorded a $64 million goodwill impairment charge for the Middle East reporting
unit. The impairment resulted from a decline in business conditions in the Middle East during the
latter half of 2013.
See Note 5—“Goodwill” in the Notes to our consolidated financial statements and “Critical
Accounting Policies—Goodwill” within Management’s Discussion and Analysis for additional
information.
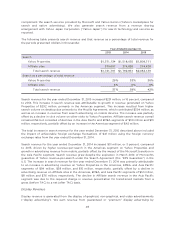
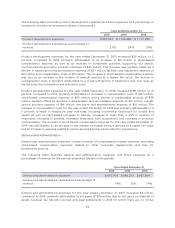
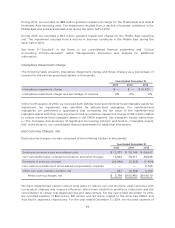
Intangibles Impairment Charge
The following table presents intangibles impairment charge and those charges as a percentage of
revenue for the periods presented (dollars in thousands):
Years Ended December 31,
2013 2014 2015
Intangibles impairment charge
$ — $ — $ 15,423
Intangibles impairment charge as a percentage of revenue
0% 0% 0%
In the fourth quarter of 2015, we reviewed both definite-lived and indefinite-lived intangible assets for
impairment. No impairment was identified for definite-lived intangibles. For indefinite-lived
intangibles, we performed a quantitative test comparing the fair value of the indefinite-lived
intangible assets with their carrying amount and recorded an impairment charge of $15 million related
to certain indefinite-lived intangible assets in the EMEA segment. See Intangible Assets within Note
1—“The Company And Summary Of Significant Accounting Policies” and Note 6—“Intangible Assets,
Net” in the Notes to our consolidated financial statements for additional information.
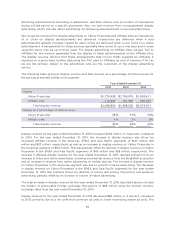
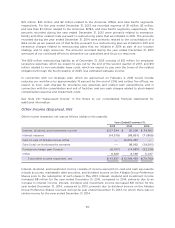
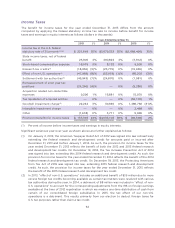
Restructuring Charges, Net
Restructuring charges, net was comprised of the following (dollars in thousands):
Year Ended December 31,
2013 2014 2015
Employee severance pay and related costs
$ 12,337 $ 30,749 $ 69,042
Non-cancelable lease, contract termination, and other charges
15,822 79,317 36,526
Reversals of previous charges
(24,940) (3,222) (7,404)
Non-cash accelerations of stock-based compensation expense
— — 2,705
Other non-cash charges (credits), net
547 (3,394) 3,150
Restructuring charges, net
$ 3,766 $103,450 $104,019
We have implemented various restructuring plans to reduce our cost structure, align resources with
our product strategy and improve efficiency, which have resulted in workforce reductions and the
consolidation of certain real estate facilities and data centers. For the year ended December 31, 2015,
we recorded expense of $69 million, $31 million, and $4 million related to the Americas, EMEA, and
Asia Pacific segments, respectively. For the year ended December 31, 2014, we recorded expense of
59