Yahoo 2015 Annual Report Download - page 56
Download and view the complete annual report
Please find page 56 of the 2015 Yahoo annual report below. You can navigate through the pages in the report by either clicking on the pages listed below, or by using the keyword search tool below to find specific information within the annual report.-
 1
1 -
2
-
3
-
4
-
5
-
6
-
7
-
8
-
9
-
10
-
11
-
12
-
13
-
14
-
15
-
16
-
17
-
18
-
19
-
20
-
21
-
22
-
23
-
24
-
25
-
26
-
27
-
28
-
29
-
30
-
31
-
32
-
33
-
34
-
35
-
36
-
37
-
38
-
39
-
40
-
41
-
42
-
43
-
44
-
45
-
 46
46 -
 47
47 -
 48
48 -
 49
49 -
 50
50 -
 51
51 -
 52
52 -
 53
53 -
 54
54 -
 55
55 -
 56
56 -
 57
57 -
 58
58 -
 59
59 -
 60
60 -
 61
61 -
 62
62 -
 63
63 -
 64
64 -
 65
65 -
 66
66 -
67
-
68
-
69
-
70
-
71
-
72
-
73
-
74
-
75
-
76
-
77
-
78
-
79
-
80
-
81
-
82
-
83
-
84
-
85
-
86
-
87
-
88
-
89
-
90
-
91
-
92
-
93
-
94
-
95
-
96
-
97
-
98
-
99
-
100
-
101
-
102
-
103
-
104
-
105
-
106
-
107
-
108
-
109
-
110
-
111
-
112
-
113
-
114
-
115
-
116
-
117
-
118
-
119
-
120
-
121
-
122
-
123
-
124
-
125
-
126
-
127
-
128
-
129
-
130
-
131
-
132
-
133
-
134
-
135
-
136
-
137
-
138
-
139
-
140
-
141
-
142
-
143
-
144
-
145
-
146
-
147
-
148
-
149
-
150
-
151
-
152
-
153
-
154
-
155
-
156
-
157
-
158
-
159
-
160
-
161
-
162
-
163
-
164
-
165
-
166
-
167
-
168
-
169
-
170
-
171
-
172
-
173
-
174
-
175
-
176
-
177
-
178
-
179
-
180
 |
 |
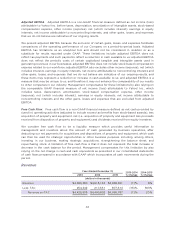
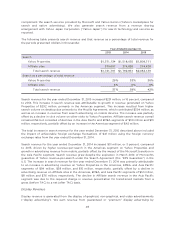
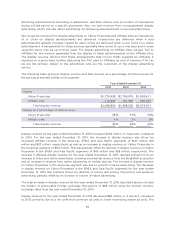
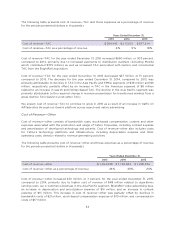
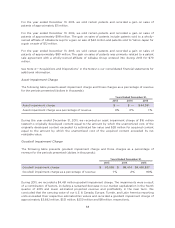
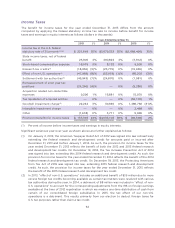
2014 was primarily attributable to royalty revenue associated with the patent sale and license
agreement that we entered into in the second quarter of 2014. See Note 4—“Acquisitions and
Dispositions” in the Notes to our consolidated financial statements for additional information.
We expect other revenue to decline in 2016, as compared to 2015, as a result of completing the
recognition of deferred revenue under the TIPLA with Alibaba Group in the third quarter of 2015, for
which we no longer recognize associated fees revenue.
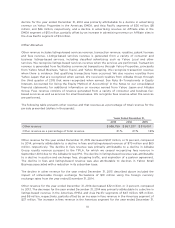
Search and Display Metrics
We present information below regarding the number of “Paid Clicks” and “Price-per-Click” for search
and the number of “Ads Sold” and “Price-per-Ad” for display. This information is derived from
internal data.
“Paid Clicks” are defined as clicks by end-users on sponsored search listings (excluding native ad
units, which are defined as display ads that appear in the content streams viewed by users) on Yahoo
Properties and Affiliate sites. Advertisers generally pay for sponsored search listings on a per-click
basis. “Search click-driven revenue” is gross search revenue (GAAP search revenue plus the related
revenue share with third parties), excluding the Microsoft RPS Guarantee and search revenue from
Yahoo Japan. “Price-per-Click” is defined as search click-driven revenue divided by our total number
of Paid Clicks.
“Ads Sold” consist of display ad impressions for paying advertisers on Yahoo Properties (including
mobile) and Affiliate sites (including Flurry and BrightRoll). “Price-per-Ad” is defined as display
revenue from Yahoo Properties (including mobile) and Affiliate sites (including Flurry and BrightRoll)
divided by our total number of Ads Sold. Our price and volume metrics for display are based on
display revenue which we report on a gross basis (before TAC), and include data for graphical,
sponsorship, and native ad units on Yahoo Properties (including mobile) and Affiliate sites (including
Flurry and BrightRoll).
We periodically review, refine and update our methodologies for monitoring, gathering, and counting
number of Paid Clicks and Ads Sold and for calculating search click-driven revenue, Price-per-Click,
and Price-per-Ad. Commencing in the first quarter 2015, our display price and volume metrics (Price-
per-Ad and Ads Sold) include (a) results from Yahoo Properties worldwide (other than Japan, where
Yahoo branded sites are operated by third-party licensees), whereas previously those metrics
excluded countries and regions where historical data was not previously retained in a manner that
would support period-to-period comparisons; (b) results from Affiliate sites (including Affiliates of
Flurry and BrightRoll) and (c) historical Tumblr data commencing in the three months ended June 30,
2013, whereas previously Tumblr data was limited to (i) native ad results commencing in the three
months ended March 31, 2014 and (ii) other display ad results commencing in the three months ended
September 30, 2014. Prior period amounts have been updated to conform to the current
presentation.
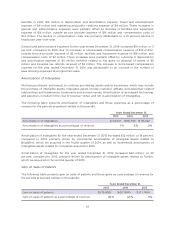
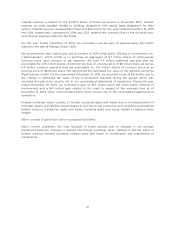
Search Metrics
For the year ended December 31, 2015, Paid Clicks increased 6 percent and Price-per-Click increased
2 percent, compared to 2014. The increase in Paid Clicks for the year ended December 31, 2015 was
primarily attributable to an increase in Paid Clicks on Yahoo Properties in the Americas segment,
attributable to our agreements with Mozilla and other distribution partners, partially offset by a
decline in Paid Clicks from Affiliate and Yahoo traffic. The increase in Price-per-Click for year ended
December 31, 2015 was attributable to a higher mix of traffic from the Americas segment, which is
higher monetizing as compared to other segments, as well as improved pricing from Affiliate traffic.
52