Humana 2013 Annual Report Download - page 120
Download and view the complete annual report
Please find page 120 of the 2013 Humana annual report below. You can navigate through the pages in the report by either clicking on the pages listed below, or by using the keyword search tool below to find specific information within the annual report.-
 1
1 -
2
-
3
-
4
-
5
-
6
-
7
-
8
-
9
-
10
-
11
-
12
-
13
-
14
-
15
-
16
-
17
-
18
-
19
-
20
-
21
-
22
-
23
-
24
-
25
-
26
-
27
-
28
-
29
-
30
-
31
-
32
-
33
-
34
-
35
-
36
-
37
-
38
-
39
-
40
-
41
-
42
-
43
-
44
-
45
-
46
-
47
-
48
-
49
-
50
-
51
-
52
-
53
-
54
-
55
-
56
-
57
-
58
-
59
-
60
-
61
-
62
-
63
-
64
-
65
-
66
-
67
-
68
-
69
-
70
-
71
-
72
-
73
-
74
-
75
-
76
-
77
-
78
-
79
-
80
-
81
-
82
-
83
-
84
-
85
-
86
-
87
-
88
-
89
-
90
-
91
-
92
-
93
-
94
-
95
-
96
-
97
-
98
-
99
-
100
-
101
-
102
-
103
-
104
-
105
-
106
-
107
-
108
-
109
-
 110
110 -
 111
111 -
 112
112 -
 113
113 -
 114
114 -
 115
115 -
 116
116 -
 117
117 -
 118
118 -
 119
119 -
 120
120 -
 121
121 -
 122
122 -
 123
123 -
 124
124 -
 125
125 -
 126
126 -
 127
127 -
 128
128 -
 129
129 -
 130
130 -
131
-
132
-
133
-
134
-
135
-
136
-
137
-
138
-
139
-
140
-
141
-
142
-
143
-
144
-
145
-
146
-
147
-
148
-
149
-
150
-
151
-
152
-
153
-
154
-
155
-
156
-
157
-
158
-
159
-
160
-
161
-
162
-
163
-
164
-
165
-
166
-
167
-
168
 |
 |
Humana Inc.
NOTES TO CONSOLIDATED FINANCIAL STATEMENTS—(Continued)
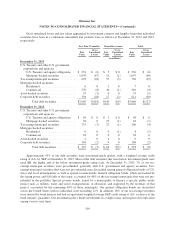
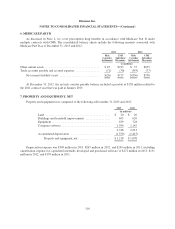
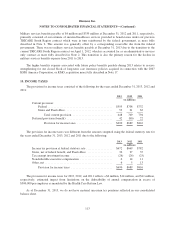
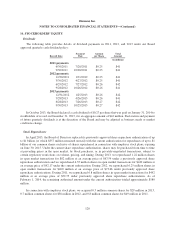
6. MEDICARE PART D
As discussed in Note 2, we cover prescription drug benefits in accordance with Medicare Part D under
multiple contracts with CMS. The consolidated balance sheets include the following amounts associated with
Medicare Part D as of December 31, 2013 and 2012:
2013 2012
Risk
Corridor
Settlement
CMS
Subsidies/
Discounts
Risk
Corridor
Settlement
CMS
Subsidies/
Discounts
(in millions)
Other current assets ..................................... $45 $743 $ 37 $635
Trade accounts payable and accrued expenses ................ (71) (30) (393) (77)
Net current (liability) asset ........................... $(26) $713 $(356) $558
At December 31, 2012, the net risk corridor payable balance included a payable of $158 million related to
the 2011 contract year that was paid in January 2013.
7. PROPERTY AND EQUIPMENT, NET
Property and equipment was comprised of the following at December 31, 2013 and 2012:
2013 2012
(in millions)
Land ............................................ $ 20 $ 20
Buildings and leasehold improvements ................. 693 620
Equipment ........................................ 639 728
Computer software ................................. 1,396 1,145
2,748 2,513
Accumulated depreciation ........................... (1,530) (1,415)
Property and equipment, net ...................... $1,218 $ 1,098
Depreciation expense was $309 million in 2013, $263 million in 2012, and $249 million in 2011, including
amortization expense for capitalized internally developed and purchased software of $172 million in 2013, $151
million in 2012, and $139 million in 2011.
110