Humana 2013 Annual Report Download - page 19
Download and view the complete annual report
Please find page 19 of the 2013 Humana annual report below. You can navigate through the pages in the report by either clicking on the pages listed below, or by using the keyword search tool below to find specific information within the annual report.-
 1
1 -
2
-
3
-
4
-
5
-
6
-
7
-
8
-
 9
9 -
 10
10 -
 11
11 -
 12
12 -
 13
13 -
 14
14 -
 15
15 -
 16
16 -
 17
17 -
 18
18 -
 19
19 -
 20
20 -
 21
21 -
 22
22 -
 23
23 -
 24
24 -
 25
25 -
 26
26 -
 27
27 -
 28
28 -
 29
29 -
30
-
31
-
32
-
33
-
34
-
35
-
36
-
37
-
38
-
39
-
40
-
41
-
42
-
43
-
44
-
45
-
46
-
47
-
48
-
49
-
50
-
51
-
52
-
53
-
54
-
55
-
56
-
57
-
58
-
59
-
60
-
61
-
62
-
63
-
64
-
65
-
66
-
67
-
68
-
69
-
70
-
71
-
72
-
73
-
74
-
75
-
76
-
77
-
78
-
79
-
80
-
81
-
82
-
83
-
84
-
85
-
86
-
87
-
88
-
89
-
90
-
91
-
92
-
93
-
94
-
95
-
96
-
97
-
98
-
99
-
100
-
101
-
102
-
103
-
104
-
105
-
106
-
107
-
108
-
109
-
110
-
111
-
112
-
113
-
114
-
115
-
116
-
117
-
118
-
119
-
120
-
121
-
122
-
123
-
124
-
125
-
126
-
127
-
128
-
129
-
130
-
131
-
132
-
133
-
134
-
135
-
136
-
137
-
138
-
139
-
140
-
141
-
142
-
143
-
144
-
145
-
146
-
147
-
148
-
149
-
150
-
151
-
152
-
153
-
154
-
155
-
156
-
157
-
158
-
159
-
160
-
161
-
162
-
163
-
164
-
165
-
166
-
167
-
168
 |
 |

Informatics
As discussed previously, at the core of our strategy is our integrated care delivery model. We are focused on
proactive clinical outreach and member engagement. Accordingly, our Retail Segment uses the informatics and
predictive modeling capabilities of our Healthcare Services segment to identify members in need of clinical
intervention, as further described under the section titled “Our Healthcare Services Segment Products” herein.
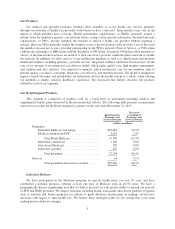
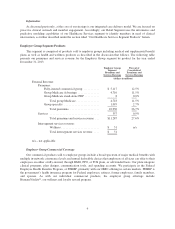
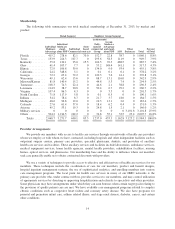
Employer Group Segment Products
This segment is comprised of products sold to employer groups including medical and supplemental benefit
plans as well as health and wellness products as described in the discussion that follows. The following table
presents our premiums and services revenue for the Employer Group segment by product for the year ended
December 31, 2013:
Employer Group
Segment
Premiums and
Services Revenue
Percent of
Consolidated
Premiums and
Services Revenue
(dollars in millions)
External Revenue:
Premiums:
Fully-insured commercial group ........... $ 5,117 12.5%
Group Medicare Advantage ............... 4,710 11.5%
Group Medicare stand-alone PDP .......... 8 0.0%
Total group Medicare ................ 4,718 11.5%
Group specialty ........................ 1,095 2.7%
Total premiums .................... 10,930 26.7%
Services .................................. 357 0.9%
Total premiums and services revenue . . . $11,287 27.6%
Intersegment services revenue:
Wellness .......................... $ 51 n/a
Total intersegment services revenue .... $ 51
n/a – not applicable
Employer Group Commercial Coverage
Our commercial products sold to employer groups include a broad spectrum of major medical benefits with
multiple in-network coinsurance levels and annual deductible choices that employers of all sizes can offer to their
employees on either a fully-insured, through HMO, PPO, or POS plans, or self-funded basis. Our plans integrate
clinical programs, plan designs, communication tools, and spending accounts. We participate in the Federal
Employee Health Benefits Program, or FEHBP, primarily with our HMO offering in certain markets. FEHBP is
the government’s health insurance program for Federal employees, retirees, former employees, family members,
and spouses. As with our individual commercial products, the employer group offerings include
HumanaVitality®, our wellness and loyalty reward program.
9