Humana 2013 Annual Report Download - page 89
Download and view the complete annual report
Please find page 89 of the 2013 Humana annual report below. You can navigate through the pages in the report by either clicking on the pages listed below, or by using the keyword search tool below to find specific information within the annual report.-
 1
1 -
2
-
3
-
4
-
5
-
6
-
7
-
8
-
9
-
10
-
11
-
12
-
13
-
14
-
15
-
16
-
17
-
18
-
19
-
20
-
21
-
22
-
23
-
24
-
25
-
26
-
27
-
28
-
29
-
30
-
31
-
32
-
33
-
34
-
35
-
36
-
37
-
38
-
39
-
40
-
41
-
42
-
43
-
44
-
45
-
46
-
47
-
48
-
49
-
50
-
51
-
52
-
53
-
54
-
55
-
56
-
57
-
58
-
59
-
60
-
61
-
62
-
63
-
64
-
65
-
66
-
67
-
68
-
69
-
70
-
71
-
72
-
73
-
74
-
75
-
76
-
77
-
78
-
 79
79 -
 80
80 -
 81
81 -
 82
82 -
 83
83 -
 84
84 -
 85
85 -
 86
86 -
 87
87 -
 88
88 -
 89
89 -
 90
90 -
 91
91 -
 92
92 -
 93
93 -
 94
94 -
 95
95 -
 96
96 -
 97
97 -
 98
98 -
 99
99 -
100
-
101
-
102
-
103
-
104
-
105
-
106
-
107
-
108
-
109
-
110
-
111
-
112
-
113
-
114
-
115
-
116
-
117
-
118
-
119
-
120
-
121
-
122
-
123
-
124
-
125
-
126
-
127
-
128
-
129
-
130
-
131
-
132
-
133
-
134
-
135
-
136
-
137
-
138
-
139
-
140
-
141
-
142
-
143
-
144
-
145
-
146
-
147
-
148
-
149
-
150
-
151
-
152
-
153
-
154
-
155
-
156
-
157
-
158
-
159
-
160
-
161
-
162
-
163
-
164
-
165
-
166
-
167
-
168
 |
 |

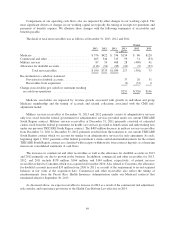
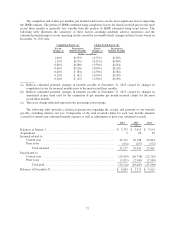
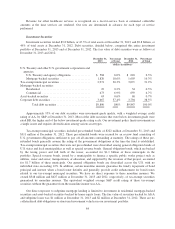
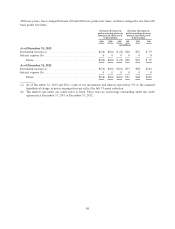
Benefits expense associated with military services and provisions associated with future policy benefits
excluded from the previous table was as follows for the years ended December 31, 2013, 2012 and 2011:
2013 2012 2011
(in millions)
Military services ............................................. $(27) $ 908 $3,247
Future policy benefits ......................................... 354 136 114
Total .................................................. $327 $1,044 $3,361
Military services benefit expense for 2013 reflects the beneficial effect of a favorable settlement of contract
claims with the DoD partially offset by expenses associated with our contracts with the Veterans Administration.
Military services benefits payable of $4 million and $339 million at December 31, 2012 and 2011, respectively,
primarily consisted of our estimate of incurred healthcare services provided to beneficiaries under our previous
TRICARE South Region contract which were in turn reimbursed by the federal government. This amount was
generally offset by a receivable from the federal government. There was no military services benefits payable at
December 31, 2013 due to the transition to the current TRICARE South Region contract on April 1, 2012, which
is accounted for as an administrative services only contract as more fully described in Note 2 to the consolidated
financial statements included in Item 8. – Financial Statements and Supplementary Data. This transition is also
the primary reason for the decline in military services benefits expense from 2011 to 2013. Our previous
TRICARE contract that expired on March 31, 2012 contained provisions where we shared the risk with the
federal government for the cost of health benefits. Therefore, the impact on our income from operations from
changes in estimate for TRICARE benefits payable was reduced substantially by the federal government’s share
of the risk. The net change in income from operations as determined retrospectively, after giving consideration to
claim development occurring in the current period, was an increase of approximately $2 million for 2011.
Future policy benefits payable of $2.2 billion and $1.9 billion at December 31, 2013 and 2012, respectively,
represent liabilities for long-duration insurance policies including long-term care insurance, life insurance,
annuities, and certain health and other supplemental policies sold to individuals for which some of the premium
received in the earlier years is intended to pay anticipated benefits to be incurred in future years. At policy
issuance, these reserves are recognized on a net level premium method based on interest rates, mortality,
morbidity, and maintenance expense assumptions. Interest rates are based on our expected net investment returns
on the investment portfolio supporting the reserves for these blocks of business. Mortality, a measure of expected
death, and morbidity, a measure of health status, assumptions are based on published actuarial tables, modified
based upon actual experience. The assumptions used to determine the liability for future policy benefits are
established and locked in at the time each contract is issued and only change if our expected future experience
deteriorates to the point that the level of the liability, together with the present value of future gross premiums,
are not adequate to provide for future expected policy benefits and maintenance costs (i.e. the loss recognition
date). Because these policies have long-term claim payout periods, there is a greater risk of significant variability
in claims costs, either positive or negative. We perform loss recognition tests at least annually in the fourth
quarter, and more frequently if adverse events or changes in circumstances indicate that the level of the liability,
together with the present value of future gross premiums, may not be adequate to provide for future expected
policy benefits and maintenance costs.
Future policy benefits payable include $1.4 billion at December 31, 2013 and $1.1 billion at December 31,
2012 associated with a non-strategic closed block of long-term care insurance policies acquired in connection
with the 2007 KMG acquisition. Approximately 33,300 policies remain in force as of December 31, 2013. No
new policies have been written since 2005 under this closed block. Future policy benefits payable includes
amounts charged to accumulated other comprehensive income for an additional liability that would exist on our
closed-block of long-term care insurance policies if unrealized gains on the sale of the investments backing such
products had been realized and the proceeds reinvested at then current yields. There was no additional liability at
December 31, 2013 and $119 million of additional liability at December 31, 2012. Amounts charged to
accumulated other comprehensive income are net of applicable deferred taxes.
79