Humana 2013 Annual Report Download - page 69
Download and view the complete annual report
Please find page 69 of the 2013 Humana annual report below. You can navigate through the pages in the report by either clicking on the pages listed below, or by using the keyword search tool below to find specific information within the annual report.-
 1
1 -
2
-
3
-
4
-
5
-
6
-
7
-
8
-
9
-
10
-
11
-
12
-
13
-
14
-
15
-
16
-
17
-
18
-
19
-
20
-
21
-
22
-
23
-
24
-
25
-
26
-
27
-
28
-
29
-
30
-
31
-
32
-
33
-
34
-
35
-
36
-
37
-
38
-
39
-
40
-
41
-
42
-
43
-
44
-
45
-
46
-
47
-
48
-
49
-
50
-
51
-
52
-
53
-
54
-
55
-
56
-
57
-
58
-
 59
59 -
 60
60 -
 61
61 -
 62
62 -
 63
63 -
 64
64 -
 65
65 -
 66
66 -
 67
67 -
 68
68 -
 69
69 -
 70
70 -
 71
71 -
 72
72 -
 73
73 -
 74
74 -
 75
75 -
 76
76 -
 77
77 -
 78
78 -
 79
79 -
80
-
81
-
82
-
83
-
84
-
85
-
86
-
87
-
88
-
89
-
90
-
91
-
92
-
93
-
94
-
95
-
96
-
97
-
98
-
99
-
100
-
101
-
102
-
103
-
104
-
105
-
106
-
107
-
108
-
109
-
110
-
111
-
112
-
113
-
114
-
115
-
116
-
117
-
118
-
119
-
120
-
121
-
122
-
123
-
124
-
125
-
126
-
127
-
128
-
129
-
130
-
131
-
132
-
133
-
134
-
135
-
136
-
137
-
138
-
139
-
140
-
141
-
142
-
143
-
144
-
145
-
146
-
147
-
148
-
149
-
150
-
151
-
152
-
153
-
154
-
155
-
156
-
157
-
158
-
159
-
160
-
161
-
162
-
163
-
164
-
165
-
166
-
167
-
168
 |
 |

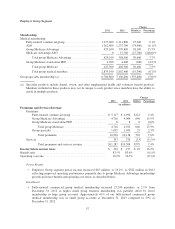
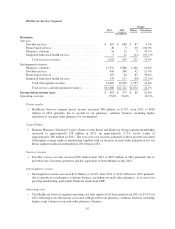
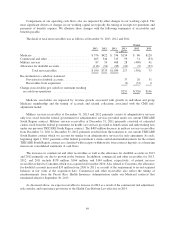
Healthcare Services Segment
Change
2013 2012 Dollars Percentage
(in millions)
Revenues:
Services:
Provider services ..................................... $ 1,127 $ 967 $ 160 16.5%
Home based services .................................. 94 40 54 135.0%
Pharmacy solutions ................................... 59 16 43 268.8%
Integrated behavioral health services ..................... 2 1 1 100.0%
Total services revenues ............................ 1,282 1,024 258 25.2%
Intersegment revenues:
Pharmacy solutions ................................... 13,079 11,352 1,727 15.2%
Provider services ..................................... 1,120 410 710 173.2%
Home based services .................................. 326 167 159 95.2%
Integrated behavioral health services ..................... 126 133 (7) (5.3)%
Total intersegment revenues ........................ 14,651 12,062 2,589 21.5%
Total services and intersegment revenues .............. $15,933 $13,086 $2,847 21.8%
Income before income taxes $ 549 $ 463 $ 86 18.6%
Operating cost ratio ....................................... 95.6% 95.8% (0.2)%
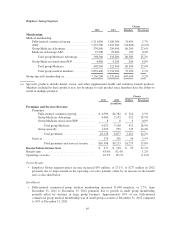
Pretax results
• Healthcare Services segment pretax income of $549 million for 2013 increased $86 million from 2012
as revenue growth and the pretax income contribution from our home based services and pharmacy
solutions businesses, as well as the acquisition of Metropolitan, were partially offset by previously-
planned investment spending associated with the integration and build-out of provider practices. The
growth in pretax income associated with our home based services business reflects the increase in
home health services provided to our Medicare Advantage members.
Script Volume
• Humana Pharmacy Solutions®script volumes for the Retail and Employer Group segment membership
increased to approximately 274 million in 2013, up 15% versus scripts of approximately 238 million in
2012. The increase primarily reflects growth associated with higher average medical membership for
2013 than in 2012.
Services revenue
• Services revenue increased $258 million, or 25.2% from 2012 to $1.3 billion for 2013 primarily due to
the acquisitions of Metropolitan and SeniorBridge as well as growth in our provider services
operations.
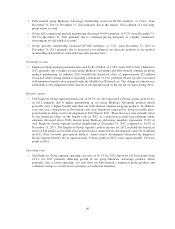
Intersegment revenues
• Intersegment revenues increased $2.6 billion, or 21.5%, from 2012 to $14.7 billion for 2013 primarily
due to growth in our pharmacy solutions business as it serves our growing membership, particularly
Medicare stand-alone PDP, and the acquisition of Metropolitan in the fourth quarter of 2012.
Operating costs
• The Healthcare Services segment operating cost ratio of 95.6% for 2013 decreased 20 basis points from
95.8% for 2012 primarily due to scale efficiencies associated with growth in our pharmacy solutions
business.
59