Humana 2013 Annual Report Download - page 95
Download and view the complete annual report
Please find page 95 of the 2013 Humana annual report below. You can navigate through the pages in the report by either clicking on the pages listed below, or by using the keyword search tool below to find specific information within the annual report.-
 1
1 -
2
-
3
-
4
-
5
-
6
-
7
-
8
-
9
-
10
-
11
-
12
-
13
-
14
-
15
-
16
-
17
-
18
-
19
-
20
-
21
-
22
-
23
-
24
-
25
-
26
-
27
-
28
-
29
-
30
-
31
-
32
-
33
-
34
-
35
-
36
-
37
-
38
-
39
-
40
-
41
-
42
-
43
-
44
-
45
-
46
-
47
-
48
-
49
-
50
-
51
-
52
-
53
-
54
-
55
-
56
-
57
-
58
-
59
-
60
-
61
-
62
-
63
-
64
-
65
-
66
-
67
-
68
-
69
-
70
-
71
-
72
-
73
-
74
-
75
-
76
-
77
-
78
-
79
-
80
-
81
-
82
-
83
-
84
-
 85
85 -
 86
86 -
 87
87 -
 88
88 -
 89
89 -
 90
90 -
 91
91 -
 92
92 -
 93
93 -
 94
94 -
 95
95 -
 96
96 -
 97
97 -
 98
98 -
 99
99 -
 100
100 -
 101
101 -
 102
102 -
 103
103 -
 104
104 -
 105
105 -
106
-
107
-
108
-
109
-
110
-
111
-
112
-
113
-
114
-
115
-
116
-
117
-
118
-
119
-
120
-
121
-
122
-
123
-
124
-
125
-
126
-
127
-
128
-
129
-
130
-
131
-
132
-
133
-
134
-
135
-
136
-
137
-
138
-
139
-
140
-
141
-
142
-
143
-
144
-
145
-
146
-
147
-
148
-
149
-
150
-
151
-
152
-
153
-
154
-
155
-
156
-
157
-
158
-
159
-
160
-
161
-
162
-
163
-
164
-
165
-
166
-
167
-
168
 |
 |

The percentage of corporate securities associated with the financial services industry was 23% at
December 31, 2013 and 2012.
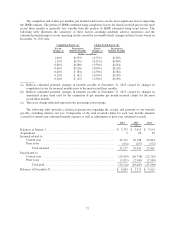
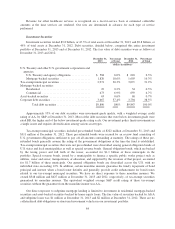
Gross unrealized losses and fair values aggregated by investment category and length of time that individual
securities have been in a continuous unrealized loss position were as follows at December 31, 2013:
Less than 12 months 12 months or more Total
Fair
Value
Gross
Unrealized
Losses
Fair
Value
Gross
Unrealized
Losses
Fair
Value
Gross
Unrealized
Losses
(in millions)
December 31, 2013
U.S. Treasury and other U.S. government
corporations and agencies:
U.S. Treasury and agency obligations .... $ 231 $ (6) $ 5 $0 $ 236 $ (6)
Mortgage-backed securities ........... 1,076 (47) 21 (1) 1,097 (48)
Tax-exempt municipal securities ........... 693 (28) 57 (5) 750 (33)
Mortgage-backed securities:
Residential ......................... 6 0 1 0 7 0
Commercial ........................ 270 (8) 40 (1) 310 (9)
Asset-backed securities ................... 35 (1) 0 0 35 (1)
Corporate debt securities .................. 594 (28) 17 (2) 611 (30)
Total debt securities ............. $2,905 $(118) $141 $(9) $3,046 $(127)
Under the other-than-temporary impairment model for debt securities held, we recognize an impairment loss
in income in an amount equal to the full difference between the amortized cost basis and the fair value when we
have the intent to sell the debt security or it is more likely than not we will be required to sell the debt security
before recovery of our amortized cost basis. However, if we do not intend to sell the debt security, we evaluate
the expected cash flows to be received as compared to amortized cost and determine if a credit loss has occurred.
In the event of a credit loss, only the amount of the impairment associated with the credit loss is recognized
currently in income with the remainder of the loss recognized in other comprehensive income.
When we do not intend to sell a security in an unrealized loss position, potential other-than-temporary
impairment is considered using a variety of factors, including the length of time and extent to which the fair
value has been less than cost; adverse conditions specifically related to the industry, geographic area or financial
condition of the issuer or underlying collateral of a security; payment structure of the security; changes in credit
rating of the security by the rating agencies; the volatility of the fair value changes; and changes in fair value of
the security after the balance sheet date. For debt securities, we take into account expectations of relevant market
and economic data. For example, with respect to mortgage and asset-backed securities, such data includes
underlying loan level data and structural features such as seniority and other forms of credit enhancements. A
decline in fair value is considered other-than-temporary when we do not expect to recover the entire amortized
cost basis of the security. We estimate the amount of the credit loss component of a debt security as the
difference between the amortized cost and the present value of the expected cash flows of the security. The
present value is determined using the best estimate of future cash flows discounted at the implicit interest rate at
the date of purchase. The risks inherent in assessing the impairment of an investment include the risk that market
factors may differ from our expectations, facts and circumstances factored into our assessment may change with
the passage of time, or we may decide to subsequently sell the investment. The determination of whether a
decline in the value of an investment is other than temporary requires us to exercise significant diligence and
judgment. The discovery of new information and the passage of time can significantly change these judgments.
The status of the general economic environment and significant changes in the national securities markets
influence the determination of fair value and the assessment of investment impairment. There is a continuing risk
that declines in fair value may occur and additional material realized losses from sales or other-than-temporary
impairments may be recorded in future periods.
85