Humana 2013 Annual Report Download - page 145
Download and view the complete annual report
Please find page 145 of the 2013 Humana annual report below. You can navigate through the pages in the report by either clicking on the pages listed below, or by using the keyword search tool below to find specific information within the annual report.-
 1
1 -
2
-
3
-
4
-
5
-
6
-
7
-
8
-
9
-
10
-
11
-
12
-
13
-
14
-
15
-
16
-
17
-
18
-
19
-
20
-
21
-
22
-
23
-
24
-
25
-
26
-
27
-
28
-
29
-
30
-
31
-
32
-
33
-
34
-
35
-
36
-
37
-
38
-
39
-
40
-
41
-
42
-
43
-
44
-
45
-
46
-
47
-
48
-
49
-
50
-
51
-
52
-
53
-
54
-
55
-
56
-
57
-
58
-
59
-
60
-
61
-
62
-
63
-
64
-
65
-
66
-
67
-
68
-
69
-
70
-
71
-
72
-
73
-
74
-
75
-
76
-
77
-
78
-
79
-
80
-
81
-
82
-
83
-
84
-
85
-
86
-
87
-
88
-
89
-
90
-
91
-
92
-
93
-
94
-
95
-
96
-
97
-
98
-
99
-
100
-
101
-
102
-
103
-
104
-
105
-
106
-
107
-
108
-
109
-
110
-
111
-
112
-
113
-
114
-
115
-
116
-
117
-
118
-
119
-
120
-
121
-
122
-
123
-
124
-
125
-
126
-
127
-
128
-
129
-
130
-
131
-
132
-
133
-
134
-
 135
135 -
 136
136 -
 137
137 -
 138
138 -
 139
139 -
 140
140 -
 141
141 -
 142
142 -
 143
143 -
 144
144 -
 145
145 -
 146
146 -
 147
147 -
 148
148 -
 149
149 -
 150
150 -
 151
151 -
 152
152 -
 153
153 -
 154
154 -
 155
155 -
156
-
157
-
158
-
159
-
160
-
161
-
162
-
163
-
164
-
165
-
166
-
167
-
168
 |
 |

Humana Inc.
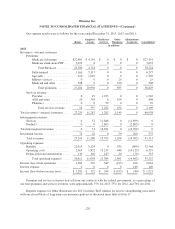
QUARTERLY FINANCIAL INFORMATION
(Unaudited)
A summary of our quarterly unaudited results of operations for the years ended December 31, 2013 and
2012 follows:
2013
First Second Third Fourth (1)
(in millions, except per share results)
Total revenues ............................................. $10,486 $10,321 $10,319 $10,187
Income (loss) before income taxes ............................. 730 654 586 (49)
Net income (loss) .......................................... 473 420 368 (30)
Basic earnings (loss) per common share ........................ 2.97 2.66 2.34 (0.19)
Diluted earnings (loss) per common share ....................... 2.95 2.63 2.31 (0.19)
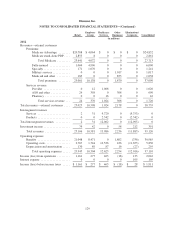
2012
First Second Third Fourth
(in millions, except per share results)
Total revenues .............................................. $10,219 $9,699 $9,651 $9,557
Income before income taxes .................................... 390 564 675 282
Net income ................................................. 248 356 426 192
Basic earnings per common share ............................... 1.51 2.19 2.65 1.21
Diluted earnings per common share .............................. 1.49 2.16 2.62 1.19
(1) The sum of quarterly amounts does not equal full year results due to the anti-dilutive impact of a loss in the
fourth quarter. The fourth quarter includes an expense of $243 million ($154 million after tax, or $0.99 per
diluted common share) for reserve strengthening associated with our closed block of long-term care
insurance policies.
135