Humana 2013 Annual Report Download - page 73
Download and view the complete annual report
Please find page 73 of the 2013 Humana annual report below. You can navigate through the pages in the report by either clicking on the pages listed below, or by using the keyword search tool below to find specific information within the annual report.-
 1
1 -
2
-
3
-
4
-
5
-
6
-
7
-
8
-
9
-
10
-
11
-
12
-
13
-
14
-
15
-
16
-
17
-
18
-
19
-
20
-
21
-
22
-
23
-
24
-
25
-
26
-
27
-
28
-
29
-
30
-
31
-
32
-
33
-
34
-
35
-
36
-
37
-
38
-
39
-
40
-
41
-
42
-
43
-
44
-
45
-
46
-
47
-
48
-
49
-
50
-
51
-
52
-
53
-
54
-
55
-
56
-
57
-
58
-
59
-
60
-
61
-
62
-
 63
63 -
 64
64 -
 65
65 -
 66
66 -
 67
67 -
 68
68 -
 69
69 -
 70
70 -
 71
71 -
 72
72 -
 73
73 -
 74
74 -
 75
75 -
 76
76 -
 77
77 -
 78
78 -
 79
79 -
 80
80 -
 81
81 -
 82
82 -
 83
83 -
84
-
85
-
86
-
87
-
88
-
89
-
90
-
91
-
92
-
93
-
94
-
95
-
96
-
97
-
98
-
99
-
100
-
101
-
102
-
103
-
104
-
105
-
106
-
107
-
108
-
109
-
110
-
111
-
112
-
113
-
114
-
115
-
116
-
117
-
118
-
119
-
120
-
121
-
122
-
123
-
124
-
125
-
126
-
127
-
128
-
129
-
130
-
131
-
132
-
133
-
134
-
135
-
136
-
137
-
138
-
139
-
140
-
141
-
142
-
143
-
144
-
145
-
146
-
147
-
148
-
149
-
150
-
151
-
152
-
153
-
154
-
155
-
156
-
157
-
158
-
159
-
160
-
161
-
162
-
163
-
164
-
165
-
166
-
167
-
168
 |
 |

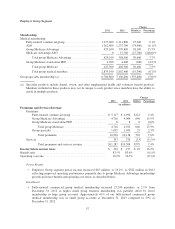
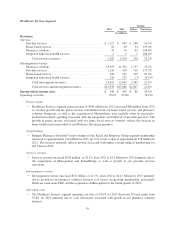
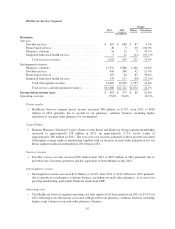
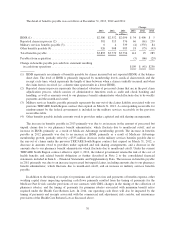
Retail Segment
Change
2012 2011 Members Percentage
Membership:
Medical membership:
Individual Medicare Advantage .......... 1,927,600 1,640,300 287,300 17.5%
Medicare stand-alone PDP .............. 3,052,700 2,613,800 438,900 16.8%
Total Retail Medicare .............. 4,980,300 4,254,100 726,200 17.1%
Individual commercial ................. 521,400 493,200 28,200 5.7%
State-based Medicaid .................. 52,100 47,600 4,500 9.5%
Total Retail medical members ....... 5,553,800 4,794,900 758,900 15.8%
Individual specialty membership (a) .......... 948,700 782,500 166,200 21.2%
(a) Specialty products include dental, vision, and other supplemental health and financial protection products.
Members included in these products may not be unique to each product since members have the ability to
enroll in multiple products.
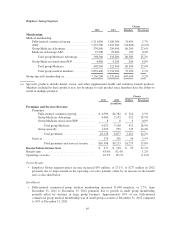
Change
2012 2011 Dollars Percentage
(in millions)
Premiums and Services Revenue:
Premiums:
Individual Medicare Advantage ........... $20,788 $18,100 $2,688 14.9%
Individual Medicare stand-alone PDP ...... 2,853 2,570 283 11.0%
Total individual Medicare ............ 23,641 20,670 2,971 14.4%
Individual commercial .................. 1,004 861 143 16.6%
State-based Medicaid ................... 185 176 9 5.1%
Individual specialty ..................... 171 124 47 37.9%
Total premiums .................... 25,001 21,831 3,170 14.5%
Services .................................. 24 16 8 50.0%
Total premiums and services revenue . . . $25,025 $21,847 $3,178 14.5%
Income before income taxes $ 1,161 $ 1,630 $ (469) (28.8)%
Benefit ratio ................................... 84.2% 81.3% 2.9%
Operating cost ratio ............................. 11.1% 11.1% 0.0%
Pretax Results
• Retail segment pretax income was $1.2 billion in 2012, a decrease of $469 million, or 28.8%, from
$1.6 billion in 2011, primarily driven by a year-over-year increase in the benefit ratio as described
below.
Enrollment
• Individual Medicare Advantage membership increased 287,300 members, or 17.5%, from
December 31, 2011 to December 31, 2012 primarily due to the 2012 enrollment season, as well as age-
in enrollment throughout the year. We acquired approximately 62,600 members with Arcadian
effective March 31, 2012. As discussed previously, we divested approximately 12,600 members
acquired with Arcadian effective January 1, 2013 in accordance with our agreement with the United
States Department of Justice.
63