Humana 2013 Annual Report Download - page 139
Download and view the complete annual report
Please find page 139 of the 2013 Humana annual report below. You can navigate through the pages in the report by either clicking on the pages listed below, or by using the keyword search tool below to find specific information within the annual report.-
 1
1 -
2
-
3
-
4
-
5
-
6
-
7
-
8
-
9
-
10
-
11
-
12
-
13
-
14
-
15
-
16
-
17
-
18
-
19
-
20
-
21
-
22
-
23
-
24
-
25
-
26
-
27
-
28
-
29
-
30
-
31
-
32
-
33
-
34
-
35
-
36
-
37
-
38
-
39
-
40
-
41
-
42
-
43
-
44
-
45
-
46
-
47
-
48
-
49
-
50
-
51
-
52
-
53
-
54
-
55
-
56
-
57
-
58
-
59
-
60
-
61
-
62
-
63
-
64
-
65
-
66
-
67
-
68
-
69
-
70
-
71
-
72
-
73
-
74
-
75
-
76
-
77
-
78
-
79
-
80
-
81
-
82
-
83
-
84
-
85
-
86
-
87
-
88
-
89
-
90
-
91
-
92
-
93
-
94
-
95
-
96
-
97
-
98
-
99
-
100
-
101
-
102
-
103
-
104
-
105
-
106
-
107
-
108
-
109
-
110
-
111
-
112
-
113
-
114
-
115
-
116
-
117
-
118
-
119
-
120
-
121
-
122
-
123
-
124
-
125
-
126
-
127
-
128
-
 129
129 -
 130
130 -
 131
131 -
 132
132 -
 133
133 -
 134
134 -
 135
135 -
 136
136 -
 137
137 -
 138
138 -
 139
139 -
 140
140 -
 141
141 -
 142
142 -
 143
143 -
 144
144 -
 145
145 -
 146
146 -
 147
147 -
 148
148 -
 149
149 -
150
-
151
-
152
-
153
-
154
-
155
-
156
-
157
-
158
-
159
-
160
-
161
-
162
-
163
-
164
-
165
-
166
-
167
-
168
 |
 |

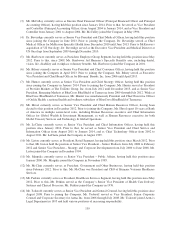
Humana Inc.
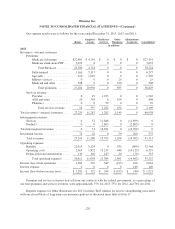
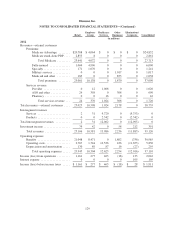
NOTES TO CONSOLIDATED FINANCIAL STATEMENTS—(Continued)
Retail
Employer
Group
Healthcare
Services
Other
Businesses
Eliminations/
Corporate Consolidated
(in millions)
2012
Revenues—external customers
Premiums:
Medicare Advantage ........ $20,788 $ 4,064 $ 0 $ 0 $ 0 $24,852
Medicare stand-alone PDP .... 2,853 8 0 0 0 2,861
Total Medicare ......... 23,641 4,072 0 0 0 27,713
Fully-insured .............. 1,004 4,996 0 0 0 6,000
Specialty .................. 171 1,070 0 0 0 1,241
Military services ............ 0 0 0 1,017 0 1,017
Medicaid and other ......... 185 0 0 853 0 1,038
Total premiums ........ 25,001 10,138 0 1,870 0 37,009
Services revenue:
Provider .................. 0 12 1,008 0 0 1,020
ASO and other ............. 24 358 0 308 0 690
Pharmacy ................. 0 0 16 0 0 16
Total services revenue . . . 24 370 1,024 308 0 1,726
Total revenues—external customers .... 25,025 10,508 1,024 2,178 0 38,735
Intersegment revenues
Services ...................... 2 31 9,720 0 (9,753) 0
Products ...................... 0 0 2,342 0 (2,342) 0
Total intersegment revenues .......... 2 31 12,062 0 (12,095) 0
Investment income .................. 79 42 0 58 212 391
Total revenues ................. 25,106 10,581 13,086 2,236 (11,883) 39,126
Operating expenses:
Benefits ...................... 21,048 8,471 0 1,802 (336) 30,985
Operating costs ................. 2,767 1,744 12,536 436 (11,653) 5,830
Depreciation and amortization ..... 130 89 87 16 (27) 295
Total operating expenses ..... 23,945 10,304 12,623 2,254 (12,016) 37,110
Income (loss) from operations ......... 1,161 277 463 (18) 133 2,016
Interest expense .................... 0 0 0 0 105 105
Income (loss) before income taxes ..... $ 1,161 $ 277 $ 463 $ (18) $ 28 $ 1,911
129