Humana 2013 Annual Report Download - page 77
Download and view the complete annual report
Please find page 77 of the 2013 Humana annual report below. You can navigate through the pages in the report by either clicking on the pages listed below, or by using the keyword search tool below to find specific information within the annual report.-
 1
1 -
2
-
3
-
4
-
5
-
6
-
7
-
8
-
9
-
10
-
11
-
12
-
13
-
14
-
15
-
16
-
17
-
18
-
19
-
20
-
21
-
22
-
23
-
24
-
25
-
26
-
27
-
28
-
29
-
30
-
31
-
32
-
33
-
34
-
35
-
36
-
37
-
38
-
39
-
40
-
41
-
42
-
43
-
44
-
45
-
46
-
47
-
48
-
49
-
50
-
51
-
52
-
53
-
54
-
55
-
56
-
57
-
58
-
59
-
60
-
61
-
62
-
63
-
64
-
65
-
66
-
 67
67 -
 68
68 -
 69
69 -
 70
70 -
 71
71 -
 72
72 -
 73
73 -
 74
74 -
 75
75 -
 76
76 -
 77
77 -
 78
78 -
 79
79 -
 80
80 -
 81
81 -
 82
82 -
 83
83 -
 84
84 -
 85
85 -
 86
86 -
 87
87 -
88
-
89
-
90
-
91
-
92
-
93
-
94
-
95
-
96
-
97
-
98
-
99
-
100
-
101
-
102
-
103
-
104
-
105
-
106
-
107
-
108
-
109
-
110
-
111
-
112
-
113
-
114
-
115
-
116
-
117
-
118
-
119
-
120
-
121
-
122
-
123
-
124
-
125
-
126
-
127
-
128
-
129
-
130
-
131
-
132
-
133
-
134
-
135
-
136
-
137
-
138
-
139
-
140
-
141
-
142
-
143
-
144
-
145
-
146
-
147
-
148
-
149
-
150
-
151
-
152
-
153
-
154
-
155
-
156
-
157
-
158
-
159
-
160
-
161
-
162
-
163
-
164
-
165
-
166
-
167
-
168
 |
 |

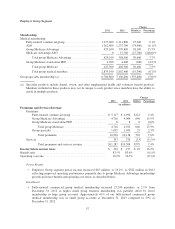
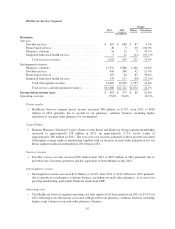
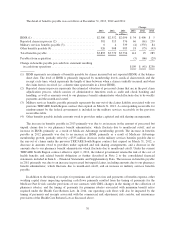
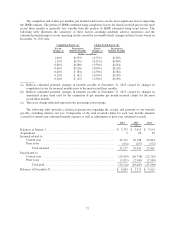
Healthcare Services Segment
Change
2012 2011 Dollars Percentage
(in millions)
Revenues:
Services:
Provider services ..................................... $ 967 $ 880 $ 87 9.9%
Home based services .................................. 40 0 40 100.0%
Pharmacy solutions ................................... 16 11 5 45.5%
Integrated behavioral health services ..................... 1 12 (11) (91.7)%
Total services revenues ............................ 1,024 903 121 13.4%
Intersegment revenues:
Pharmacy solutions ................................... 11,352 9,886 1,466 14.8%
Provider services ..................................... 410 368 42 11.4%
Home based services .................................. 167 84 83 98.8%
Integrated behavioral health services ..................... 133 171 (38) (22.2)%
Total intersegment revenues ........................ 12,062 10,509 1,553 14.8%
Total services and intersegment revenues .............. $13,086 $11,412 $1,674 14.7%
Income before income taxes $ 463 $ 377 $ 86 22.8%
Operating cost ratio ....................................... 95.8% 96.0% (0.2)%
Pretax results
• Healthcare Services segment pretax income increased $86 million, or 22.8%, from 2011 to $463
million in 2012 primarily due to growth in our pharmacy solutions business, including higher
utilization of our mail-order pharmacy by our members.
Script Volume
• Humana Pharmacy Solutions®script volumes for the Retail and Employer Group segment membership
increased to approximately 238 million in 2012, up approximately 15.5% versus scripts of
approximately 206 million in 2011. The year-over-year increase primarily reflects growth associated
with higher average medical membership together with an increase in mail order penetration for our
Retail segment medical membership in 2012 than in 2011.
Services revenue
• Provider services revenue increased $87 million from 2011 to $967 million in 2012 primarily due to
growth in our Concentra operations and the acquisition of SeniorBridge in July 2012.
Intersegment revenues
• Intersegment revenues increased $1.6 billion, or 14.8%, from 2011 to $12.0 billion for 2012 primarily
due to growth in our pharmacy solutions business, including our mail-order pharmacy, as it serves our
growing membership, particularly Medicare stand-alone PDP.
Operating costs
• The Healthcare Services segment operating cost ratio improved 20 basis points from 2011 to 95.8% for
2012 reflecting scale efficiencies associated with growth in our pharmacy solutions business, including
higher script volumes in our mail-order pharmacy business.
67