Humana 2013 Annual Report Download - page 122
Download and view the complete annual report
Please find page 122 of the 2013 Humana annual report below. You can navigate through the pages in the report by either clicking on the pages listed below, or by using the keyword search tool below to find specific information within the annual report.-
 1
1 -
2
-
3
-
4
-
5
-
6
-
7
-
8
-
9
-
10
-
11
-
12
-
13
-
14
-
15
-
16
-
17
-
18
-
19
-
20
-
21
-
22
-
23
-
24
-
25
-
26
-
27
-
28
-
29
-
30
-
31
-
32
-
33
-
34
-
35
-
36
-
37
-
38
-
39
-
40
-
41
-
42
-
43
-
44
-
45
-
46
-
47
-
48
-
49
-
50
-
51
-
52
-
53
-
54
-
55
-
56
-
57
-
58
-
59
-
60
-
61
-
62
-
63
-
64
-
65
-
66
-
67
-
68
-
69
-
70
-
71
-
72
-
73
-
74
-
75
-
76
-
77
-
78
-
79
-
80
-
81
-
82
-
83
-
84
-
85
-
86
-
87
-
88
-
89
-
90
-
91
-
92
-
93
-
94
-
95
-
96
-
97
-
98
-
99
-
100
-
101
-
102
-
103
-
104
-
105
-
106
-
107
-
108
-
109
-
110
-
111
-
 112
112 -
 113
113 -
 114
114 -
 115
115 -
 116
116 -
 117
117 -
 118
118 -
 119
119 -
 120
120 -
 121
121 -
 122
122 -
 123
123 -
 124
124 -
 125
125 -
 126
126 -
 127
127 -
 128
128 -
 129
129 -
 130
130 -
 131
131 -
 132
132 -
133
-
134
-
135
-
136
-
137
-
138
-
139
-
140
-
141
-
142
-
143
-
144
-
145
-
146
-
147
-
148
-
149
-
150
-
151
-
152
-
153
-
154
-
155
-
156
-
157
-
158
-
159
-
160
-
161
-
162
-
163
-
164
-
165
-
166
-
167
-
168
 |
 |

Humana Inc.
NOTES TO CONSOLIDATED FINANCIAL STATEMENTS—(Continued)
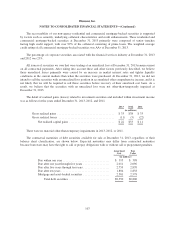
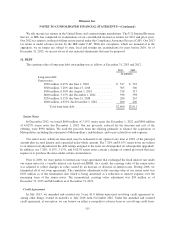
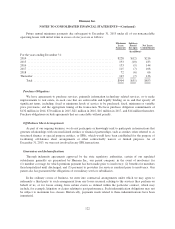
9. BENEFITS PAYABLE
Activity in benefits payable, excluding military services, was as follows for the years ended December 31,
2013, 2012 and 2011:
2013 2012 2011
(in millions)
Balances at January 1 .............................................. $ 3,775 $ 3,415 $ 3,214
Acquisitions ..................................................... 5 66 29
Incurred related to:
Current year ................................................. 32,711 30,198 25,834
Prior years .................................................. (474) (257) (372)
Total incurred ............................................ 32,237 29,941 25,462
Paid related to:
Current year ................................................. (29,103) (26,738) (22,742)
Prior years .................................................. (3,021) (2,909) (2,548)
Total paid ............................................... (32,124) (29,647) (25,290)
Balances at December 31 ........................................... $ 3,893 $ 3,775 $ 3,415
Amounts incurred related to prior years vary from previously estimated liabilities as the claims ultimately
are settled. Negative amounts reported for incurred related to prior years result from claims being ultimately
settled for amounts less than originally estimated (favorable development).
Actuarial standards require the use of assumptions based on moderately adverse experience, which generally
results in favorable reserve development, or reserves that are considered redundant. We experienced favorable
medical claims reserve development related to prior fiscal years of $474 million in 2013, $257 million in 2012,
and $372 million in 2011. The favorable medical claims reserve development for 2013, 2012, and 2011 primarily
reflects the consistent application of trend and completion factors estimated using an assumption of moderately
adverse conditions. In addition, the favorable medical claims reserve development during 2013 reflects better
than originally expected utilization across most of our major business lines and increased financial
recoveries. The increase in financial recoveries primarily resulted from claim audit process enhancements as well
as increased volume of claim audits and expanded audit scope. All lines of business benefitted from these
improvements. Favorable development during 2011 reflects improvements in the claims processing environment
and, to a lesser extent, better than originally estimated utilization. The improvements during 2011 resulted from
increased audits of provider billings as well as system enhancements that improved claim recovery functionality.
Benefits expense associated with military services and provisions associated with future policy benefits
excluded from the previous table was as follows for the years ended December 31, 2013, 2012 and 2011:
2013 2012 2011
(in millions)
Military services ..................................... $(27) $ 908 $3,247
Future policy benefits ................................. 354 136 114
Total .......................................... $327 $1,044 $3,361
Military services benefit expense for 2013 reflects the beneficial effect of a favorable settlement of contract
claims with the DoD partially offset by expenses associated with our contracts with the Veterans Administration.
112