Humana 2013 Annual Report Download - page 74
Download and view the complete annual report
Please find page 74 of the 2013 Humana annual report below. You can navigate through the pages in the report by either clicking on the pages listed below, or by using the keyword search tool below to find specific information within the annual report.-
 1
1 -
2
-
3
-
4
-
5
-
6
-
7
-
8
-
9
-
10
-
11
-
12
-
13
-
14
-
15
-
16
-
17
-
18
-
19
-
20
-
21
-
22
-
23
-
24
-
25
-
26
-
27
-
28
-
29
-
30
-
31
-
32
-
33
-
34
-
35
-
36
-
37
-
38
-
39
-
40
-
41
-
42
-
43
-
44
-
45
-
46
-
47
-
48
-
49
-
50
-
51
-
52
-
53
-
54
-
55
-
56
-
57
-
58
-
59
-
60
-
61
-
62
-
63
-
 64
64 -
 65
65 -
 66
66 -
 67
67 -
 68
68 -
 69
69 -
 70
70 -
 71
71 -
 72
72 -
 73
73 -
 74
74 -
 75
75 -
 76
76 -
 77
77 -
 78
78 -
 79
79 -
 80
80 -
 81
81 -
 82
82 -
 83
83 -
 84
84 -
85
-
86
-
87
-
88
-
89
-
90
-
91
-
92
-
93
-
94
-
95
-
96
-
97
-
98
-
99
-
100
-
101
-
102
-
103
-
104
-
105
-
106
-
107
-
108
-
109
-
110
-
111
-
112
-
113
-
114
-
115
-
116
-
117
-
118
-
119
-
120
-
121
-
122
-
123
-
124
-
125
-
126
-
127
-
128
-
129
-
130
-
131
-
132
-
133
-
134
-
135
-
136
-
137
-
138
-
139
-
140
-
141
-
142
-
143
-
144
-
145
-
146
-
147
-
148
-
149
-
150
-
151
-
152
-
153
-
154
-
155
-
156
-
157
-
158
-
159
-
160
-
161
-
162
-
163
-
164
-
165
-
166
-
167
-
168
 |
 |
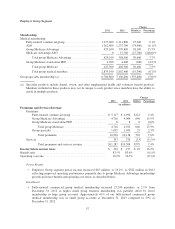
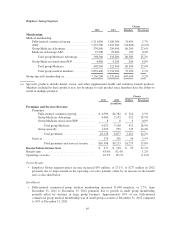
• Individual Medicare stand-alone PDP membership increased 438,900 members, or 16.8%, from
December 31, 2011 to December 31, 2012 primarily from higher gross sales during the 2012
enrollment season, particularly for our Humana-Walmart plan offering, supplemented by dual-eligible
and age-in enrollments throughout the year.
• Individual specialty membership increased 166,200, or 21.2%, from December 31, 2011 to
December 31, 2012 primarily driven by increased membership in dental offerings.
Premiums revenue
• Retail segment premiums increased $3.2 billion, or 14.5%, from 2011 to 2012 primarily due to a 17.6%
increase in average individual Medicare Advantage membership. Individual Medicare Advantage per
member premiums decreased approximately 2% in 2012 compared to 2011, primarily driven by a
higher percentage of members that aged-in that generally carry a lower risk score than other members
and accordingly a lower premium per member as well as lower per member premiums for members
acquired in connection with the Arcadian acquisition effective March 31, 2012. Individual Medicare
stand-alone PDP premiums revenue increased $283 million, or 11.0%, in 2012 compared to 2011
primarily due to an 18.9% increase in average individual PDP membership, partially offset by a
decrease in individual Medicare stand-alone PDP per member premiums. This was primarily a result of
sales of our Humana-Walmart plan.
Benefits expense
• The Retail segment benefit ratio increased 290 basis points from 81.3% in 2011 to 84.2% in 2012.
During 2012, we experienced a significant increase in the benefit ratio for our individual Medicare
Advantage products primarily due to a planned increase in the target benefit ratio associated with
positioning for the Health Care Reform Law funding changes and minimum benefit ratio requirements,
a higher benefit ratio experienced on new membership than the assumptions used in our 2012 Medicare
bids, and increased outpatient utilization for both new and existing members. In addition, year-over-
year comparisons of the benefit ratio were negatively impacted by lower favorable prior-period
medical claims reserve development in 2012 than in 2011 and a year-over-year increase in clinicians
and other health care quality expenditures given our continuing growth in membership. The Retail
segment’s pretax income for 2012 included the beneficial effect of $192 million in favorable prior-
period medical claims reserve development versus $245 million in 2011. This favorable prior-period
medical claims reserve development decreased the Retail segment benefit ratio by approximately 80
basis points in 2012 versus approximately 110 basis points in 2011.
Operating costs
• The Retail segment operating cost ratio of 11.1% for 2012 was comparable of that for 2011 primarily
due to scale efficiencies associated with servicing higher year-over-year membership together with our
continued focus on operating cost efficiencies, partially offset by higher year-over-year clinical,
provider, and technological infrastructure spending.
64