Humana 2013 Annual Report Download - page 64
Download and view the complete annual report
Please find page 64 of the 2013 Humana annual report below. You can navigate through the pages in the report by either clicking on the pages listed below, or by using the keyword search tool below to find specific information within the annual report.-
 1
1 -
2
-
3
-
4
-
5
-
6
-
7
-
8
-
9
-
10
-
11
-
12
-
13
-
14
-
15
-
16
-
17
-
18
-
19
-
20
-
21
-
22
-
23
-
24
-
25
-
26
-
27
-
28
-
29
-
30
-
31
-
32
-
33
-
34
-
35
-
36
-
37
-
38
-
39
-
40
-
41
-
42
-
43
-
44
-
45
-
46
-
47
-
48
-
49
-
50
-
51
-
52
-
53
-
 54
54 -
 55
55 -
 56
56 -
 57
57 -
 58
58 -
 59
59 -
 60
60 -
 61
61 -
 62
62 -
 63
63 -
 64
64 -
 65
65 -
 66
66 -
 67
67 -
 68
68 -
 69
69 -
 70
70 -
 71
71 -
 72
72 -
 73
73 -
 74
74 -
75
-
76
-
77
-
78
-
79
-
80
-
81
-
82
-
83
-
84
-
85
-
86
-
87
-
88
-
89
-
90
-
91
-
92
-
93
-
94
-
95
-
96
-
97
-
98
-
99
-
100
-
101
-
102
-
103
-
104
-
105
-
106
-
107
-
108
-
109
-
110
-
111
-
112
-
113
-
114
-
115
-
116
-
117
-
118
-
119
-
120
-
121
-
122
-
123
-
124
-
125
-
126
-
127
-
128
-
129
-
130
-
131
-
132
-
133
-
134
-
135
-
136
-
137
-
138
-
139
-
140
-
141
-
142
-
143
-
144
-
145
-
146
-
147
-
148
-
149
-
150
-
151
-
152
-
153
-
154
-
155
-
156
-
157
-
158
-
159
-
160
-
161
-
162
-
163
-
164
-
165
-
166
-
167
-
168
 |
 |
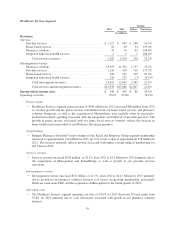
favorable reserve development, or reserves that are considered redundant. We experienced favorable medical
claims reserve development related to prior fiscal years of $474 million in 2013 and $257 million in 2012. These
increases in favorable medical claims reserve development primarily resulted from claims trend for the prior year
ultimately developing more favorably than originally expected across most of our major business lines and
increased financial recoveries. The increase in financial recoveries primarily resulted from claim audit process
enhancements as well as increased volume of claim audits and expanded audit scope.
The consolidated benefit ratio for 2013 was 83.9%, an increase of 20 basis points from 2012 primarily due
to reserve strengthening associated with our closed-block of long-term care insurance policies included with
Other Businesses as discussed above, partially offset by the increase in favorable prior-year medical claims
reserve development of $217 million from 2012 to 2013.
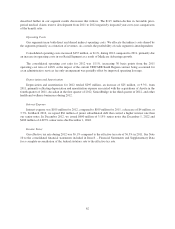
Operating Costs
Our segments incur both direct and shared indirect operating costs. We allocate the indirect costs shared by
the segments primarily as a function of revenues. As a result, the profitability of each segment is interdependent.
Consolidated operating costs increased $525 million, or 9.0%, in 2013 compared to 2012 primarily due to an
increase in operating costs in our Retail and Healthcare Services segments. The increase in the Retail segment
primarily reflects investment spending for exchanges under the Health Care Reform Law and new state-based
contracts as well as increased marketing spending for Medicare.
The consolidated operating cost ratio for 2013 was 15.5%, increasing 40 basis points from 2012. The impact
of the current TRICARE South Region contract being accounted for as an administrative services fee only
arrangement beginning April 1, 2012 was partially offset by improved operating leverage in our Retail and
Employer Group segments.
Depreciation and Amortization
Depreciation and amortization for 2013 totaled $333 million, an increase of $38 million, or 12.9%, from
2012 primarily due to capital expenditures and depreciation and amortization associated with 2012 and 2013
acquisitions.
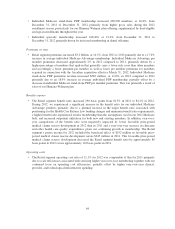
Interest Expense
Interest expense was $140 million for 2013 compared to $105 million for 2012, an increase of $35 million,
or 33.3%. In December 2012, we issued $600 million of 3.15% senior notes due December 1, 2022 and $400
million of 4.625% senior notes due December 1, 2042.
Income Taxes
Our effective tax rate during 2013 was 35.9% compared to the effective tax rate of 36.1% in 2012. We
expect our effective income tax rate to increase significantly in 2014 to approximately 45% to 47% due to the
non-deductible health insurance industry fee levied on the insurance industry beginning in 2014. See Note 10 to
the consolidated financial statements included in Item 8. – Financial Statements and Supplementary Data for a
complete reconciliation of the federal statutory rate to the effective tax rate.
54