Humana 2013 Annual Report Download - page 76
Download and view the complete annual report
Please find page 76 of the 2013 Humana annual report below. You can navigate through the pages in the report by either clicking on the pages listed below, or by using the keyword search tool below to find specific information within the annual report.-
 1
1 -
2
-
3
-
4
-
5
-
6
-
7
-
8
-
9
-
10
-
11
-
12
-
13
-
14
-
15
-
16
-
17
-
18
-
19
-
20
-
21
-
22
-
23
-
24
-
25
-
26
-
27
-
28
-
29
-
30
-
31
-
32
-
33
-
34
-
35
-
36
-
37
-
38
-
39
-
40
-
41
-
42
-
43
-
44
-
45
-
46
-
47
-
48
-
49
-
50
-
51
-
52
-
53
-
54
-
55
-
56
-
57
-
58
-
59
-
60
-
61
-
62
-
63
-
64
-
65
-
 66
66 -
 67
67 -
 68
68 -
 69
69 -
 70
70 -
 71
71 -
 72
72 -
 73
73 -
 74
74 -
 75
75 -
 76
76 -
 77
77 -
 78
78 -
 79
79 -
 80
80 -
 81
81 -
 82
82 -
 83
83 -
 84
84 -
 85
85 -
 86
86 -
87
-
88
-
89
-
90
-
91
-
92
-
93
-
94
-
95
-
96
-
97
-
98
-
99
-
100
-
101
-
102
-
103
-
104
-
105
-
106
-
107
-
108
-
109
-
110
-
111
-
112
-
113
-
114
-
115
-
116
-
117
-
118
-
119
-
120
-
121
-
122
-
123
-
124
-
125
-
126
-
127
-
128
-
129
-
130
-
131
-
132
-
133
-
134
-
135
-
136
-
137
-
138
-
139
-
140
-
141
-
142
-
143
-
144
-
145
-
146
-
147
-
148
-
149
-
150
-
151
-
152
-
153
-
154
-
155
-
156
-
157
-
158
-
159
-
160
-
161
-
162
-
163
-
164
-
165
-
166
-
167
-
168
 |
 |
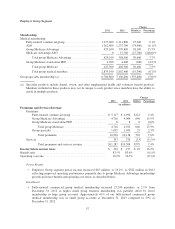
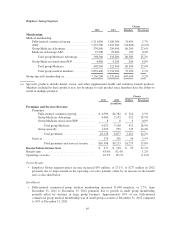
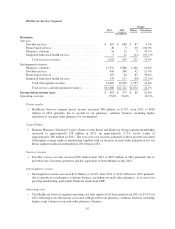
• Fully-insured group Medicare Advantage membership increased 80,200 members, or 27.6%, from
December 31, 2011 to December 31, 2012 primarily due to the January 2012 addition of a new large
group retiree account.
• Group ASO commercial medical membership decreased 54,600 members, or 4.2%, from December 31,
2011 to December 31, 2012 primarily due to continued pricing discipline in a highly competitive
environment for self-funded accounts.
• Group specialty membership increased 603,600 members, or 9.2%, from December 31, 2011 to
December 31, 2012 primarily due to increased cross-selling of our specialty products to our medical
membership and growth in stand-alone specialty product sales.
Premiums revenue
• Employer Group segment premiums increased by $1.3 billion, or 13.8%, from 2011 to $10.1 billion for
2012 primarily due to higher average group Medicare Advantage and fully-insured commercial group
medical membership. In addition, 2012 included the beneficial effect of approximately $25 million
associated with revising estimates regarding calculations of 2011 premium rebates payable associated
with minimum benefit ratios required under the Health Care Reform Law. This change in estimate was
attributable to the refinement of the state-level calculations based on the run out of claims during 2012.
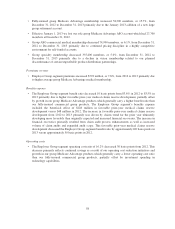
Benefits expense
• The Employer Group segment benefit ratio of 83.6% for 2012 increased 120 basis points from 82.4%
in 2011 primarily due to higher membership in our group Medicare Advantage products which
generally carry a higher benefit ratio than our fully-insured commercial group products. In addition,
year-over-year comparisons of the benefit ratio were negatively impacted by lower favorable prior-
period medical claims reserve development in 2012 than in 2011. These increases were partially offset
by the beneficial effect on the benefit ratio in 2012 of a reduction in prior-year premium rebate
estimates discussed above. Fully-insured group Medicare Advantage members represented 13.0% of
total Employer Group segment medical membership at December 31, 2012 compared to 10.4% at
December 31, 2011. The Employer Group segment’s pretax income for 2012 included the beneficial
effect of $48 million in favorable prior-period medical claims reserve development versus $114 million
in 2011. This favorable prior-period medical claims reserve development decreased the Employer
Group segment benefit ratio by approximately 50 basis points in 2012 versus approximately 130 basis
points in 2011.
Operating costs
• The Employer Group segment operating cost ratio of 16.5% for 2012 improved 160 basis points from
18.1% for 2011 primarily reflecting growth in our group Medicare Advantage products which
generally carry a lower operating cost ratio than our fully-insured commercial group products and
continued savings as a result of our operating cost reduction initiatives.
66