Humana 2013 Annual Report Download - page 121
Download and view the complete annual report
Please find page 121 of the 2013 Humana annual report below. You can navigate through the pages in the report by either clicking on the pages listed below, or by using the keyword search tool below to find specific information within the annual report.-
 1
1 -
2
-
3
-
4
-
5
-
6
-
7
-
8
-
9
-
10
-
11
-
12
-
13
-
14
-
15
-
16
-
17
-
18
-
19
-
20
-
21
-
22
-
23
-
24
-
25
-
26
-
27
-
28
-
29
-
30
-
31
-
32
-
33
-
34
-
35
-
36
-
37
-
38
-
39
-
40
-
41
-
42
-
43
-
44
-
45
-
46
-
47
-
48
-
49
-
50
-
51
-
52
-
53
-
54
-
55
-
56
-
57
-
58
-
59
-
60
-
61
-
62
-
63
-
64
-
65
-
66
-
67
-
68
-
69
-
70
-
71
-
72
-
73
-
74
-
75
-
76
-
77
-
78
-
79
-
80
-
81
-
82
-
83
-
84
-
85
-
86
-
87
-
88
-
89
-
90
-
91
-
92
-
93
-
94
-
95
-
96
-
97
-
98
-
99
-
100
-
101
-
102
-
103
-
104
-
105
-
106
-
107
-
108
-
109
-
110
-
 111
111 -
 112
112 -
 113
113 -
 114
114 -
 115
115 -
 116
116 -
 117
117 -
 118
118 -
 119
119 -
 120
120 -
 121
121 -
 122
122 -
 123
123 -
 124
124 -
 125
125 -
 126
126 -
 127
127 -
 128
128 -
 129
129 -
 130
130 -
 131
131 -
132
-
133
-
134
-
135
-
136
-
137
-
138
-
139
-
140
-
141
-
142
-
143
-
144
-
145
-
146
-
147
-
148
-
149
-
150
-
151
-
152
-
153
-
154
-
155
-
156
-
157
-
158
-
159
-
160
-
161
-
162
-
163
-
164
-
165
-
166
-
167
-
168
 |
 |
Humana Inc.
NOTES TO CONSOLIDATED FINANCIAL STATEMENTS—(Continued)
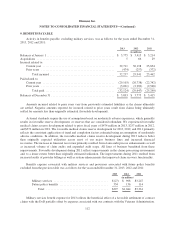
8. GOODWILL AND OTHER INTANGIBLE ASSETS
The carrying amount of goodwill for our reportable segments has been retrospectively adjusted to conform
to the 2013 segment change discussed in Note 2, as well as refinements in our estimates regarding the allocation
of purchase price associated with our Metropolitan acquisition discussed in Note 3. Changes in the carrying
amount of goodwill for our reportable segments for the years ended December 31, 2013 and 2012 were as
follows:
Retail
Employer
Group
Health &
Well -Being
Services
Other
Businesses Total
(in millions)
Balance at December 31, 2011.................... $ 762 $196 $1,733 $49 $2,740
Acquisitions .............................. 172 0 679 43 894
Subsequent payments/adjustments ............. (3) 9 0 0 6
Balance at December 31, 2012.................... $ 931 $205 $2,412 $92 $3,640
Acquisitions .............................. 76 0 40 0 116
Dispositions .............................. 0 0 (17) 0 (17)
Subsequent payments/adjustments ............. 0 0 (6) 0 (6)
Balance at December 31, 2013.................... $1,007 $205 $2,429 $92 $3,733
The following table presents details of our other intangible assets included in other long-term assets in the
accompanying consolidated balance sheets at December 31, 2013 and 2012:
Weighted
Average
Life
2013 2012
Cost
Accumulated
Amortization Net Cost
Accumulated
Amortization Net
(in millions)
Other intangible assets:
Customer contracts/relationships . . . 9.6 yrs $ 792 $310 $482 $ 733 $237 $496
Trade names and technology ...... 13.1 yrs 200 40 160 190 21 169
Provider contracts ............... 15.0 yrs 51 23 28 51 19 32
Noncompetes and other .......... 6.5yrs 52 29 23 51 17 34
Total other intangible assets . . . 10.3 yrs $1,095 $402 $693 $1,025 $294 $731
Amortization expense for other intangible assets was approximately $117 million in 2013, $75 million in
2012, and $54 million in 2011. The following table presents our estimate of amortization expense for each of the
five next succeeding fiscal years:
(in millions)
For the years ending December 31,:
2014 ........................................ $114
2015 ........................................ 103
2016 ........................................ 95
2017 ........................................ 85
2018 ........................................ 78
111