Humana 2013 Annual Report Download - page 8
Download and view the complete annual report
Please find page 8 of the 2013 Humana annual report below. You can navigate through the pages in the report by either clicking on the pages listed below, or by using the keyword search tool below to find specific information within the annual report.-
 1
1 -
 2
2 -
 3
3 -
 4
4 -
 5
5 -
 6
6 -
 7
7 -
 8
8 -
 9
9 -
 10
10 -
 11
11 -
 12
12 -
 13
13 -
 14
14 -
 15
15 -
 16
16 -
 17
17 -
 18
18 -
 19
19 -
20
-
21
-
22
-
23
-
24
-
25
-
26
-
27
-
28
-
29
-
30
-
31
-
32
-
33
-
34
-
35
-
36
-
37
-
38
-
39
-
40
-
41
-
42
-
43
-
44
-
45
-
46
-
47
-
48
-
49
-
50
-
51
-
52
-
53
-
54
-
55
-
56
-
57
-
58
-
59
-
60
-
61
-
62
-
63
-
64
-
65
-
66
-
67
-
68
-
69
-
70
-
71
-
72
-
73
-
74
-
75
-
76
-
77
-
78
-
79
-
80
-
81
-
82
-
83
-
84
-
85
-
86
-
87
-
88
-
89
-
90
-
91
-
92
-
93
-
94
-
95
-
96
-
97
-
98
-
99
-
100
-
101
-
102
-
103
-
104
-
105
-
106
-
107
-
108
-
109
-
110
-
111
-
112
-
113
-
114
-
115
-
116
-
117
-
118
-
119
-
120
-
121
-
122
-
123
-
124
-
125
-
126
-
127
-
128
-
129
-
130
-
131
-
132
-
133
-
134
-
135
-
136
-
137
-
138
-
139
-
140
-
141
-
142
-
143
-
144
-
145
-
146
-
147
-
148
-
149
-
150
-
151
-
152
-
153
-
154
-
155
-
156
-
157
-
158
-
159
-
160
-
161
-
162
-
163
-
164
-
165
-
166
-
167
-
168
 |
 |

8 2013 Annual Report
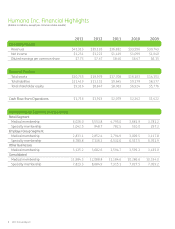
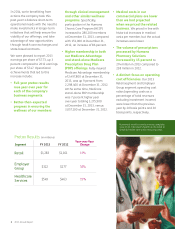
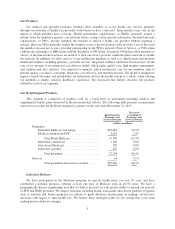
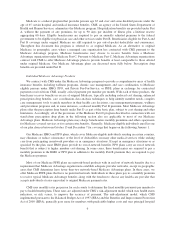
FY 2012
$1,161
$277
$463
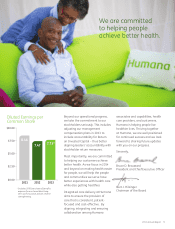
In 2014, we’re benefitting from
actions the company took this
past year to balance short-term
operational needs with the need to
make investments in longer-term
initiatives that will help ensure the
viability of our offerings, and take
advantage of new opportunities
through health care exchanges and
state-based contracts.
We were pleased to report 2013
earnings per share of $7.73, up 3
percent compared to 2012 earnings
per share of $7.47. Operational
achievements that led to this
increase include:
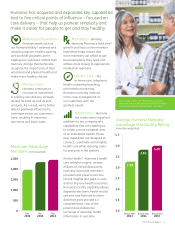
• Full-year pretax results
rose year over year for
each of the company’s
business segments.
• Better-than-expected
progress in ensuring the
wellness of our members
through clinical management
and other similar wellness
programs. Specifically,
participation in the Humana
Chronic Care Program (HCCP)
increased to 280,200 members
at December 31, 2013, compared
with 151,000 at December 31,
2012, an increase of 86 percent.
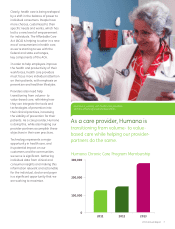
• Higher membership in both
our Medicare Advantage
and stand-alone Medicare
Prescription Drug Plan
(PDP) offerings. Fully-insured
Medicare Advantage membership
of 2,497,800 at December 31,
2013, was up 9 percent from
2,298,400 at December 31, 2012.
At the same time, Medicare
stand-alone PDP membership
was 7 percent higher year
over year totaling 3,275,900
at December 31, 2013, versus
3,057,100 at December 31, 2012.
• Medical costs in our
commercial plans are lower
than we had projected
when we priced the related
business. We priced in line with
historical increases in medical
costs per member, but the actual
increases were lower.
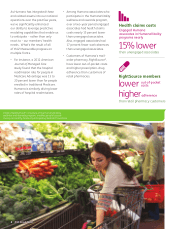
• The volume of prescriptions
processed by Humana
Pharmacy Solutions
increased by 15 percent to
274 million in 2013 compared to
238 million in 2012.
• A distinct focus on operating
cost efficiencies. Our 2013
Retail segment and Employer
Group segment operating cost
ratios (operating costs as a
percentage of total revenues
excluding investment income)
were lower than the previous
year by 20 basis points and 30
basis points, respectively.
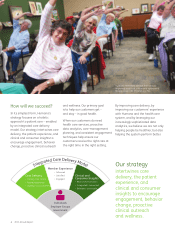
Humana’s work to create a more complete
view of an individual’s health is intended to
simplify health care while reducing costs.
Pretax Results (in millions)
Retail
Employer
Group
Healthcare
Services
FY 2013
$1,283
$322
$549
11%
Year-over-Year
Change
16%
19%
Segment