Humana 2013 Annual Report Download - page 140
Download and view the complete annual report
Please find page 140 of the 2013 Humana annual report below. You can navigate through the pages in the report by either clicking on the pages listed below, or by using the keyword search tool below to find specific information within the annual report.-
 1
1 -
2
-
3
-
4
-
5
-
6
-
7
-
8
-
9
-
10
-
11
-
12
-
13
-
14
-
15
-
16
-
17
-
18
-
19
-
20
-
21
-
22
-
23
-
24
-
25
-
26
-
27
-
28
-
29
-
30
-
31
-
32
-
33
-
34
-
35
-
36
-
37
-
38
-
39
-
40
-
41
-
42
-
43
-
44
-
45
-
46
-
47
-
48
-
49
-
50
-
51
-
52
-
53
-
54
-
55
-
56
-
57
-
58
-
59
-
60
-
61
-
62
-
63
-
64
-
65
-
66
-
67
-
68
-
69
-
70
-
71
-
72
-
73
-
74
-
75
-
76
-
77
-
78
-
79
-
80
-
81
-
82
-
83
-
84
-
85
-
86
-
87
-
88
-
89
-
90
-
91
-
92
-
93
-
94
-
95
-
96
-
97
-
98
-
99
-
100
-
101
-
102
-
103
-
104
-
105
-
106
-
107
-
108
-
109
-
110
-
111
-
112
-
113
-
114
-
115
-
116
-
117
-
118
-
119
-
120
-
121
-
122
-
123
-
124
-
125
-
126
-
127
-
128
-
129
-
 130
130 -
 131
131 -
 132
132 -
 133
133 -
 134
134 -
 135
135 -
 136
136 -
 137
137 -
 138
138 -
 139
139 -
 140
140 -
 141
141 -
 142
142 -
 143
143 -
 144
144 -
 145
145 -
 146
146 -
 147
147 -
 148
148 -
 149
149 -
 150
150 -
151
-
152
-
153
-
154
-
155
-
156
-
157
-
158
-
159
-
160
-
161
-
162
-
163
-
164
-
165
-
166
-
167
-
168
 |
 |

Humana Inc.
NOTES TO CONSOLIDATED FINANCIAL STATEMENTS—(Continued)
Retail
Employer
Group
Healthcare
Services
Other
Businesses
Eliminations/
Corporate Consolidated
(in millions)
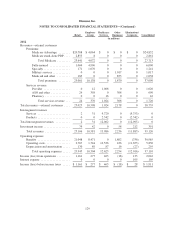
2011
Revenues—external customers
Premiums:
Medicare Advantage .......... $18,100 $3,152 $ 0 $ 0 $ 0 $21,252
Medicare stand-alone PDP ...... 2,570 8 0 0 0 2,578
Total Medicare ........... 20,670 3,160 0 0 0 23,830
Fully-insured ................ 861 4,782 0 0 0 5,643
Specialty .................... 124 935 0 0 0 1,059
Military services .............. 0 0 0 3,616 0 3,616
Medicaid and other ........... 176 0 0 782 0 958
Total premiums .......... 21,831 8,877 0 4,398 0 35,106
Services revenue:
Provider .................... 0 0 892 0 0 892
ASO and other ............... 16 356 0 85 0 457
Pharmacy ................... 0 0 11 0 0 11
Total services revenue ..... 16 356 903 85 0 1,360
Total revenues—external customers ...... 21,847 9,233 903 4,483 0 36,466
Intersegment revenues
Services ........................ 0 18 8,689 0 (8,707) 0
Products ........................ 0 0 1,820 0 (1,820) 0
Total intersegment revenues ............ 0 18 10,509 0 (10,527) 0
Investment income .................... 76 48 0 54 188 366
Total revenues ................... 21,923 9,299 11,412 4,537 (10,339) 36,832
Operating expenses:
Benefits ........................ 17,753 7,318 0 4,041 (289) 28,823
Operating costs ................... 2,421 1,675 10,956 445 (10,102) 5,395
Depreciation and amortization ....... 119 88 79 10 (26) 270
Total operating expenses ....... 20,293 9,081 11,035 4,496 (10,417) 34,488
Income (loss) from operations ........... 1,630 218 377 41 78 2,344
Interest expense ...................... 0 0 0 0 109 109
Income (loss) before income taxes ....... $ 1,630 $ 218 $ 377 $ 41 $ (31) $ 2,235
17. EXPENSES ASSOCIATED WITH LONG-DURATION INSURANCE PRODUCTS
Premiums associated with our long-duration insurance products accounted for approximately 2% of our
consolidated premiums and services revenue for the year ended December 31, 2013. We use long-duration
accounting for products such as long-term care, life insurance, annuities, and certain health and other
supplemental policies sold to individuals because they are expected to remain in force for an extended period
beyond one year and because premium received in the earlier years is intended to pay anticipated benefits to be
incurred in future years.As a result, we defer policy acquisition costs, primarily consisting of commissions, and
amortize them over the estimated life of the policies in proportion to premiums earned.
130