Humana 2013 Annual Report Download - page 55
Download and view the complete annual report
Please find page 55 of the 2013 Humana annual report below. You can navigate through the pages in the report by either clicking on the pages listed below, or by using the keyword search tool below to find specific information within the annual report.-
 1
1 -
2
-
3
-
4
-
5
-
6
-
7
-
8
-
9
-
10
-
11
-
12
-
13
-
14
-
15
-
16
-
17
-
18
-
19
-
20
-
21
-
22
-
23
-
24
-
25
-
26
-
27
-
28
-
29
-
30
-
31
-
32
-
33
-
34
-
35
-
36
-
37
-
38
-
39
-
40
-
41
-
42
-
43
-
44
-
 45
45 -
 46
46 -
 47
47 -
 48
48 -
 49
49 -
 50
50 -
 51
51 -
 52
52 -
 53
53 -
 54
54 -
 55
55 -
 56
56 -
 57
57 -
 58
58 -
 59
59 -
 60
60 -
 61
61 -
 62
62 -
 63
63 -
 64
64 -
 65
65 -
66
-
67
-
68
-
69
-
70
-
71
-
72
-
73
-
74
-
75
-
76
-
77
-
78
-
79
-
80
-
81
-
82
-
83
-
84
-
85
-
86
-
87
-
88
-
89
-
90
-
91
-
92
-
93
-
94
-
95
-
96
-
97
-
98
-
99
-
100
-
101
-
102
-
103
-
104
-
105
-
106
-
107
-
108
-
109
-
110
-
111
-
112
-
113
-
114
-
115
-
116
-
117
-
118
-
119
-
120
-
121
-
122
-
123
-
124
-
125
-
126
-
127
-
128
-
129
-
130
-
131
-
132
-
133
-
134
-
135
-
136
-
137
-
138
-
139
-
140
-
141
-
142
-
143
-
144
-
145
-
146
-
147
-
148
-
149
-
150
-
151
-
152
-
153
-
154
-
155
-
156
-
157
-
158
-
159
-
160
-
161
-
162
-
163
-
164
-
165
-
166
-
167
-
168
 |
 |
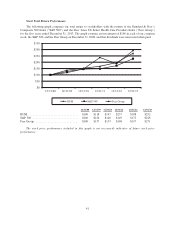
We allocate most operating expenses to our segments. Assets and certain corporate income and expenses are not
allocated to the segments, including the portion of investment income not supporting segment operations, interest
expense on corporate debt, and certain other corporate expenses. These items are managed at the corporate level.
These corporate amounts are reported separately from our reportable segments and included with intersegment
eliminations.
Seasonality
One of the product offerings of our Retail segment is Medicare stand-alone prescription drug plans, or
PDPs, under the Medicare Part D program. These plans provide varying degrees of coverage. Our quarterly
Retail segment earnings and operating cash flows are impacted by the Medicare Part D benefit design and
changes in the composition of our membership. The Medicare Part D benefit design results in coverage that
varies as a member’s cumulative out-of-pocket costs pass through successive stages of a member’s plan period
which begins annually on January 1 for renewals. These plan designs generally result in us sharing a greater
portion of the responsibility for total prescription drug costs in the early stages and less in the latter stages. As a
result, the PDP benefit ratio generally decreases as the year progresses. In addition, the number of low-income
senior members as well as year-over-year changes in the mix of membership in our stand-alone PDP products
affects the quarterly benefit ratio pattern.
Our Employer Group segment also experiences seasonality in the benefit ratio pattern. However, the effect
is opposite of Medicare stand-alone PDP in the Retail segment, with the Employer Group’s benefit ratio
increasing as fully-insured members progress through their annual deductible and maximum out-of-pocket
expenses. Similarly, our fully-insured individual commercial medical products in our Retail segment experience
seasonality in the benefit ratio like the Employer Group segment, particularly our high-deductible health plans, or
HDHPs.
In addition, the Retail segment also experiences seasonality in the operating cost ratio as a result of costs
incurred in the second half of the year associated with the Medicare and individual health care exchange
marketing season.
2013 Highlights
Consolidated
• Our 2013 results reflect the continued implementation of our strategy to offer our members affordable
health care combined with a positive consumer experience in growing markets. At the core of this
strategy is our integrated care delivery model, which unites quality care, high member engagement, and
sophisticated data analytics. Our approach to primary, physician-directed care for our members aims to
provide quality care that is consistent, integrated, cost-effective, and member-focused, provided by
both employed physicians and physicians with network contract arrangements. The model is designed
to improve health outcomes and affordability for individuals and for the health system as a whole,
while offering our members a simple, seamless healthcare experience. We believe this strategy is
positioning us for long-term growth in both membership and earnings. At December 31, 2013,
approximately 561,500 members, or 27.1%, of our individual Medicare Advantage membership were
in risk arrangements under our integrated care delivery model, as compared to 511,700 members, or
26.5%, at December 31, 2012.
• In addition, our pretax results for the year ended December 31, 2013 reflect improved operating
performance across most of our major business lines, including membership growth in our individual
and group Medicare Advantage products, as described below. The improved operating performance
reflects our continued focus and executional discipline involved in key initiatives like our chronic care
program, including increased care management professional staffing and clinical assessments.
• Comparisons of the benefit ratios and operating cost ratios for the years ended December 31, 2013 and
December 31, 2012 are impacted by the transition to the current TRICARE South Region contract on
45