Humana 2013 Annual Report Download - page 78
Download and view the complete annual report
Please find page 78 of the 2013 Humana annual report below. You can navigate through the pages in the report by either clicking on the pages listed below, or by using the keyword search tool below to find specific information within the annual report.-
 1
1 -
2
-
3
-
4
-
5
-
6
-
7
-
8
-
9
-
10
-
11
-
12
-
13
-
14
-
15
-
16
-
17
-
18
-
19
-
20
-
21
-
22
-
23
-
24
-
25
-
26
-
27
-
28
-
29
-
30
-
31
-
32
-
33
-
34
-
35
-
36
-
37
-
38
-
39
-
40
-
41
-
42
-
43
-
44
-
45
-
46
-
47
-
48
-
49
-
50
-
51
-
52
-
53
-
54
-
55
-
56
-
57
-
58
-
59
-
60
-
61
-
62
-
63
-
64
-
65
-
66
-
67
-
 68
68 -
 69
69 -
 70
70 -
 71
71 -
 72
72 -
 73
73 -
 74
74 -
 75
75 -
 76
76 -
 77
77 -
 78
78 -
 79
79 -
 80
80 -
 81
81 -
 82
82 -
 83
83 -
 84
84 -
 85
85 -
 86
86 -
 87
87 -
 88
88 -
89
-
90
-
91
-
92
-
93
-
94
-
95
-
96
-
97
-
98
-
99
-
100
-
101
-
102
-
103
-
104
-
105
-
106
-
107
-
108
-
109
-
110
-
111
-
112
-
113
-
114
-
115
-
116
-
117
-
118
-
119
-
120
-
121
-
122
-
123
-
124
-
125
-
126
-
127
-
128
-
129
-
130
-
131
-
132
-
133
-
134
-
135
-
136
-
137
-
138
-
139
-
140
-
141
-
142
-
143
-
144
-
145
-
146
-
147
-
148
-
149
-
150
-
151
-
152
-
153
-
154
-
155
-
156
-
157
-
158
-
159
-
160
-
161
-
162
-
163
-
164
-
165
-
166
-
167
-
168
 |
 |

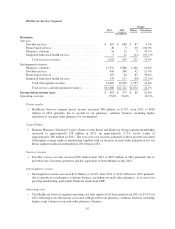
Other Businesses
Pretax loss for our Other Businesses of $18 million for 2012 compared to pretax income of $41 million for
2011. The year-over-year decline primarily reflects the combined effect of costs in connection with a litigation
settlement associated with our military services business in 2012, reserve strengthening for our closed block of
long-term care insurance policies in 2012, and a change in profitability under the current TRICARE South
Region contract in connection with our bid strategy.
Liquidity
Our primary sources of cash include receipts of premiums, services revenue, and investment and other
income, as well as proceeds from the sale or maturity of our investment securities and borrowings. Our primary
uses of cash include disbursements for claims payments, operating costs, interest on borrowings, taxes, purchases
of investment securities, acquisitions, capital expenditures, repayments on borrowings, dividends, and share
repurchases. Because premiums generally are collected in advance of claim payments by a period of up to several
months, our business normally should produce positive cash flows during periods of increasing premiums and
enrollment. Conversely, cash flows would be negatively impacted during periods of decreasing premiums and
enrollment. From period to period, our cash flows may also be affected by the timing of working capital items.
The use of operating cash flows may be limited by regulatory requirements which require, among other items,
that our regulated subsidiaries maintain minimum levels of capital and seek approval before paying dividends
from the subsidiaries to the parent. Our use of operating cash flows derived from our non-insurance subsidiaries,
such as in our Healthcare Services segment, is generally not restricted by Departments of Insurance.
For 2014, the effect of the commercial risk adjustment, risk corridor, and reinsurance provisions of the
Health Care Reform Law will impact the timing of our operating cash flows, as we expect to build a receivable in
2014 that will be collected in 2015. It is reasonably possible that the receivable could be material to our operating
cash flow in 2014. In 2014, we expect our operating cash flows to decline from 2013. Any amounts receivable or
payable associated with these risk limiting programs should not have a significant impact on subsidiary capital
and surplus.
For additional information on our liquidity risk, please refer to Item 1A. Risk Factors in this report.
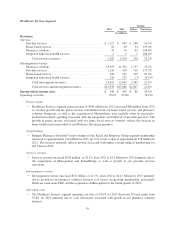
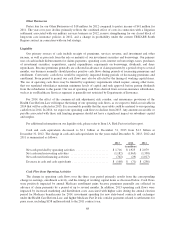
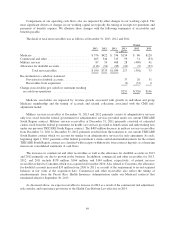
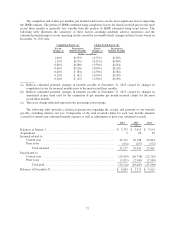
Cash and cash equivalents decreased to $1.1 billion at December 31, 2013 from $1.3 billion at
December 31, 2012. The change in cash and cash equivalents for the years ended December 31, 2013, 2012 and
2011 is summarized as follows:
2013 2012 2011
(in millions)
Net cash provided by operating activities ...................... $1,716 $ 1,923 $ 2,079
Net cash used in investing activities .......................... (1,182) (1,965) (1,358)
Net cash used in financing activities .......................... (702) (29) (1,017)
Decrease in cash and cash equivalents ......................... $ (168) $ (71) $ (296)
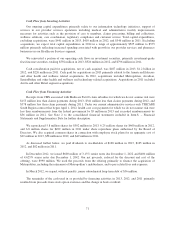
Cash Flow from Operating Activities
The change in operating cash flows over the three year period primarily results from the corresponding
change in earnings, enrollment activity, and the timing of working capital items as discussed below. Cash flows
were positively impacted by annual Medicare enrollment gains because premiums generally are collected in
advance of claim payments by a period of up to several months. In addition, 2013 operating cash flows were
impacted by increased marketing and distribution costs associated with higher sales during the annual election
period for Medicare beneficiaries for 2014, investment spending for new state-based contracts and exchanges
under the Health Care Reform Law, and higher Medicare Part D risk corridor payments related to settlements for
prior years, including $158 million related to the 2011 contract year.
68