Humana 2013 Annual Report Download - page 129
Download and view the complete annual report
Please find page 129 of the 2013 Humana annual report below. You can navigate through the pages in the report by either clicking on the pages listed below, or by using the keyword search tool below to find specific information within the annual report.-
 1
1 -
2
-
3
-
4
-
5
-
6
-
7
-
8
-
9
-
10
-
11
-
12
-
13
-
14
-
15
-
16
-
17
-
18
-
19
-
20
-
21
-
22
-
23
-
24
-
25
-
26
-
27
-
28
-
29
-
30
-
31
-
32
-
33
-
34
-
35
-
36
-
37
-
38
-
39
-
40
-
41
-
42
-
43
-
44
-
45
-
46
-
47
-
48
-
49
-
50
-
51
-
52
-
53
-
54
-
55
-
56
-
57
-
58
-
59
-
60
-
61
-
62
-
63
-
64
-
65
-
66
-
67
-
68
-
69
-
70
-
71
-
72
-
73
-
74
-
75
-
76
-
77
-
78
-
79
-
80
-
81
-
82
-
83
-
84
-
85
-
86
-
87
-
88
-
89
-
90
-
91
-
92
-
93
-
94
-
95
-
96
-
97
-
98
-
99
-
100
-
101
-
102
-
103
-
104
-
105
-
106
-
107
-
108
-
109
-
110
-
111
-
112
-
113
-
114
-
115
-
116
-
117
-
118
-
 119
119 -
 120
120 -
 121
121 -
 122
122 -
 123
123 -
 124
124 -
 125
125 -
 126
126 -
 127
127 -
 128
128 -
 129
129 -
 130
130 -
 131
131 -
 132
132 -
 133
133 -
 134
134 -
 135
135 -
 136
136 -
 137
137 -
 138
138 -
 139
139 -
140
-
141
-
142
-
143
-
144
-
145
-
146
-
147
-
148
-
149
-
150
-
151
-
152
-
153
-
154
-
155
-
156
-
157
-
158
-
159
-
160
-
161
-
162
-
163
-
164
-
165
-
166
-
167
-
168
 |
 |

Humana Inc.
NOTES TO CONSOLIDATED FINANCIAL STATEMENTS—(Continued)
We calculate the expected term for our employee stock options based on historical employee exercise
behavior and base the risk-free interest rate on a traded zero-coupon U.S. Treasury bond with a term substantially
equal to the option’s expected term.
The volatility used to value employee stock options is based on historical volatility. We calculate historical
volatility using a simple-average calculation methodology based on daily price intervals as measured over the
expected term of the option.
Activity for our option plans was as follows for the year ended December 31, 2013:
Shares Under
Option
Weighted-Average
Exercise Price
(shares in thousands)
Options outstanding at December 31, 2012 .............................. 2,233 $61.68
Granted ...................................................... 334 76.03
Exercised ..................................................... (1,242) 53.63
Cancelled ..................................................... (4) 86.61
Forfeited ..................................................... (49) 72.72
Options outstanding at December 31, 2013 .............................. 1,272 $72.81
Options exercisable at December 31, 2013 .............................. 524 $69.74
As of December 31, 2013, outstanding stock options, substantially all of which are expected to vest, had an
aggregate intrinsic value of $37 million, and a weighted-average remaining contractual term of 4.0 years. As of
December 31, 2013, exercisable stock options had an aggregate intrinsic value of $17 million, and a weighted-
average remaining contractual term of 2.8 years. The total intrinsic value of stock options exercised during 2013
was $39 million, compared with $45 million during 2012 and $88 million during 2011. Cash received from stock
option exercises totaled $67 million in 2013, $60 million in 2012, and $134 million in 2011.
Total compensation expense not yet recognized related to nonvested options was $7 million at December 31,
2013. We expect to recognize this compensation expense over a weighted-average period of approximately 1.8 years.
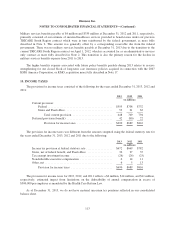
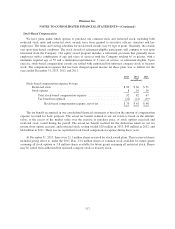
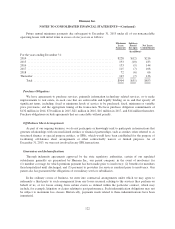
13. EARNINGS PER COMMON SHARE COMPUTATION
Detail supporting the computation of basic and diluted earnings per common share was as follows for the
years ended December 31, 2013, 2012 and 2011:
2013 2012 2011
(dollars in millions, except per
common share results, number of
shares/options in thousands)
Net income available for common stockholders ........................ $ 1,231 $ 1,222 $ 1,419
Weighted-average outstanding shares of common stock used to compute
basic earnings per common share ................................. 157,503 161,484 165,413
Dilutive effect of:
Employee stock options ....................................... 322 576 959
Restricted stock ............................................. 1,326 1,397 1,455
Shares used to compute diluted earnings per common share ............... 159,151 163,457 167,827
Basic earnings per common share ................................... $ 7.81 $ 7.56 $ 8.58
Diluted earnings per common share .................................. $ 7.73 $ 7.47 $ 8.46
Number of antidilutive stock options and restricted stock awards excluded
from computation .............................................. 704 754 864
119