Humana 2013 Annual Report Download - page 63
Download and view the complete annual report
Please find page 63 of the 2013 Humana annual report below. You can navigate through the pages in the report by either clicking on the pages listed below, or by using the keyword search tool below to find specific information within the annual report.-
 1
1 -
2
-
3
-
4
-
5
-
6
-
7
-
8
-
9
-
10
-
11
-
12
-
13
-
14
-
15
-
16
-
17
-
18
-
19
-
20
-
21
-
22
-
23
-
24
-
25
-
26
-
27
-
28
-
29
-
30
-
31
-
32
-
33
-
34
-
35
-
36
-
37
-
38
-
39
-
40
-
41
-
42
-
43
-
44
-
45
-
46
-
47
-
48
-
49
-
50
-
51
-
52
-
 53
53 -
 54
54 -
 55
55 -
 56
56 -
 57
57 -
 58
58 -
 59
59 -
 60
60 -
 61
61 -
 62
62 -
 63
63 -
 64
64 -
 65
65 -
 66
66 -
 67
67 -
 68
68 -
 69
69 -
 70
70 -
 71
71 -
 72
72 -
 73
73 -
74
-
75
-
76
-
77
-
78
-
79
-
80
-
81
-
82
-
83
-
84
-
85
-
86
-
87
-
88
-
89
-
90
-
91
-
92
-
93
-
94
-
95
-
96
-
97
-
98
-
99
-
100
-
101
-
102
-
103
-
104
-
105
-
106
-
107
-
108
-
109
-
110
-
111
-
112
-
113
-
114
-
115
-
116
-
117
-
118
-
119
-
120
-
121
-
122
-
123
-
124
-
125
-
126
-
127
-
128
-
129
-
130
-
131
-
132
-
133
-
134
-
135
-
136
-
137
-
138
-
139
-
140
-
141
-
142
-
143
-
144
-
145
-
146
-
147
-
148
-
149
-
150
-
151
-
152
-
153
-
154
-
155
-
156
-
157
-
158
-
159
-
160
-
161
-
162
-
163
-
164
-
165
-
166
-
167
-
168
 |
 |
insurance policies included with Other Businesses as discussed in Note 17 to the consolidated financial
statements included in Item 8. – Financial Statements and Supplementary Data. Year-over-year comparisons of
diluted earnings per common share are favorably impacted by a lower number of shares used to compute diluted
earnings per common share in 2013 reflecting the impact of share repurchases.
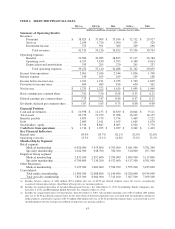
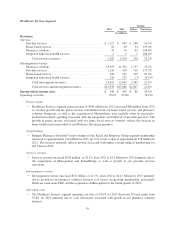
Premiums Revenue
Consolidated premiums increased $1.8 billion, or 4.9%, from 2012 to $38.8 billion for 2013 primarily due to
increases in both Retail and Employer Group segment premiums mainly driven by higher average individual and
group Medicare Advantage membership, partially offset by the impact of sequestration which became effective
April 1, 2013 as well as a decline in premiums for Other Businesses. The decline in premiums for Other
Businesses primarily reflects the transition to the current TRICARE South Region contract effective April 1,
2012, and the termination of the Puerto Rico Medicaid contracts effective September 30, 2013. As discussed in
Note 2 to the consolidated financial statements included in Item 8. – Financial Statements and Supplementary
Data, on April 1, 2012, we began delivering services under the current TRICARE South Region contract that the
DHA awarded to us on February 25, 2011. We account for revenues under the current contract net of estimated
healthcare costs similar to an administrative services fee only agreement, and as such there are no premiums
recognized under the current contract. Our previous contract was accounted for similar to our fully-insured
products and as such we recognized premiums under the previous contract. Average membership is calculated by
summing the ending membership for each month in a period and dividing the result by the number of months in a
period. Premiums revenue reflects changes in membership and average per member premiums. Items impacting
average per member premiums include changes in premium rates as well as changes in the geographic mix of
membership, the mix of product offerings, and the mix of benefit plans selected by our membership.
Services Revenue
Consolidated services revenue increased $383 million, or 22.2%, from 2012 to $2.1 billion for 2013
primarily due to an increase in services revenue in our Healthcare Services segment and an increase in services
revenue for our Other Businesses due to the transition to the current TRICARE South Region contract on April 1,
2012. The increase in services revenue in our Healthcare Services segment primarily resulted from the
acquisitions of Metropolitan on December 21, 2012 and SeniorBridge on July 6, 2012, and growth in our
provider services operations.
Investment Income
Investment income totaled $375 million for 2013, a decrease of $16 million from 2012, as higher average
invested balances were more than offset by lower interest rates and lower net realized capital gains year-over-
year.
Benefits Expense
Consolidated benefits expense was $32.6 billion for 2013, an increase of $1.6 billion, or 5.1%, from 2012
primarily due to a year-over-year increase in the Retail and Employer Group segments benefits expense, mainly
driven by an increase in the average number of Medicare members, partially offset by a decrease in benefits
expense for Other Businesses in 2013. The decrease in benefits expense for Other Businesses primarily was due
to the transition to the current administrative services only TRICARE South Region contract on April 1, 2012
and the termination of the Puerto Rico Medicaid contracts effective September 30, 2013. We do not record
benefits expense under the current TRICARE South Region contract. Our previous contract was accounted for
similar to our fully-insured products and as such we recorded benefits expense under the previous contract. Retail
segment benefits expense increased $1.9 billion, or 8.9%, from 2012 to 2013 primarily due to membership
growth. As more fully described herein under the section entitled “Benefits Expense Recognition”, actuarial
standards require the use of assumptions based on moderately adverse experience, which generally results in
53