Humana 2013 Annual Report Download - page 66
Download and view the complete annual report
Please find page 66 of the 2013 Humana annual report below. You can navigate through the pages in the report by either clicking on the pages listed below, or by using the keyword search tool below to find specific information within the annual report.-
 1
1 -
2
-
3
-
4
-
5
-
6
-
7
-
8
-
9
-
10
-
11
-
12
-
13
-
14
-
15
-
16
-
17
-
18
-
19
-
20
-
21
-
22
-
23
-
24
-
25
-
26
-
27
-
28
-
29
-
30
-
31
-
32
-
33
-
34
-
35
-
36
-
37
-
38
-
39
-
40
-
41
-
42
-
43
-
44
-
45
-
46
-
47
-
48
-
49
-
50
-
51
-
52
-
53
-
54
-
55
-
 56
56 -
 57
57 -
 58
58 -
 59
59 -
 60
60 -
 61
61 -
 62
62 -
 63
63 -
 64
64 -
 65
65 -
 66
66 -
 67
67 -
 68
68 -
 69
69 -
 70
70 -
 71
71 -
 72
72 -
 73
73 -
 74
74 -
 75
75 -
 76
76 -
77
-
78
-
79
-
80
-
81
-
82
-
83
-
84
-
85
-
86
-
87
-
88
-
89
-
90
-
91
-
92
-
93
-
94
-
95
-
96
-
97
-
98
-
99
-
100
-
101
-
102
-
103
-
104
-
105
-
106
-
107
-
108
-
109
-
110
-
111
-
112
-
113
-
114
-
115
-
116
-
117
-
118
-
119
-
120
-
121
-
122
-
123
-
124
-
125
-
126
-
127
-
128
-
129
-
130
-
131
-
132
-
133
-
134
-
135
-
136
-
137
-
138
-
139
-
140
-
141
-
142
-
143
-
144
-
145
-
146
-
147
-
148
-
149
-
150
-
151
-
152
-
153
-
154
-
155
-
156
-
157
-
158
-
159
-
160
-
161
-
162
-
163
-
164
-
165
-
166
-
167
-
168
 |
 |
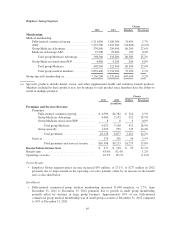
• Medicare stand-alone PDP membership increased 219,000 members, or 7.2%, from December 31,
2012 to December 31, 2013 reflecting net membership additions, primarily for our Humana-Walmart
plan offering, for the 2013 enrollment season.
• Individual commercial medical membership increased 78,700 members, or 15.1%, from December 31,
2012 to December 31, 2013 primarily reflecting net new sales in 2013. On October 1, 2013, the initial
open enrollment period began for plans effective January 1, 2014 offered through federally facilitated,
federal-state partnerships or state-based exchanges for individuals and small employers (with up to 100
employees), including certain metropolitan areas in the 14 states where Humana has public exchange
offerings.
• State-based Medicaid membership increased 33,400 members, or 64.1%, from December 31, 2012 to
December 31, 2013, primarily driven by the addition of our Kentucky Medicaid contract and Florida
Long-Term Support Services contracts, including American Eldercare.
• Individual specialty membership increased 93,800 members, or 9.9%, from December 31, 2012 to
December 31, 2013 primarily driven by increased membership in dental and vision offerings.
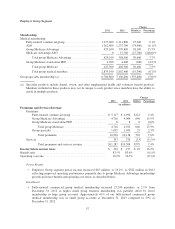
Premiums revenue
• Retail segment premiums increased $2.2 billion, or 8.8%, from 2012 to 2013 primarily due to a 7.6%
increase in average individual Medicare Advantage membership in 2013. Individual Medicare
Advantage per member premiums increased approximately 0.5% in 2013 compared to 2012, primarily
reflecting the impact of sequestration which became effective on April 1, 2013.
Benefits expense
• The Retail segment benefit ratio of 84.2% for 2013 was comparable to that of 2012. The Retail
segment’s benefits expense for 2013 included the beneficial effect of $347 million in favorable prior-
year medical claims reserve development versus $192 million in 2012. This increase in favorable prior-
year medical claims reserve development primarily was driven by claims trend for the prior year
ultimately developing more favorably than originally expected and increased financial recoveries. The
increase in financial recoveries primarily resulted from claim audit process enhancements as well as
increased volume of claim audits and expanded audit scope. This favorable prior-year medical claims
reserve development decreased the Retail segment benefit ratio by approximately 130 basis points in
2013 versus approximately 80 basis points in 2012.
Operating costs
• The Retail segment operating cost ratio of 10.9% for 2013 decreased 20 basis points from 2012. This
decrease reflects scale efficiencies associated with servicing higher year-over-year membership
together with our continued focus on operating cost efficiencies, partially offset by investment
spending for exchanges under the Health Care Reform Law and new state-based contracts as well as
increased Medicare marketing spending.
56